31 posts tagged with "Engineering"

View All Tags

9 Things I Hate About Environment Variables

· 8 min read
Jeff Dwyer
Jeff Dwyer
Prefab Founder & Engineer

In the world of software development, environment variables are how we configure our applications. The Twelve-Factor app methodology made this canonical and was a significant improvement over the terrible things we'd done before. However, I think we can do better.

Looking at the big picture, we've essentially created a system of global, untyped variables with no declarations and no defaults – a scenario that would be unacceptable in regular code. Yet, here we are, using this approach for one of the most critical aspects of our applications.

Specific Challenges with Environment Variables

1. Environment Variable Whack-a-Mole

How often have you cloned an app only to be greeted with a slew of errors due to missing environment variables? Start the app, it explodes, hunt down the value for the env var, start the app, explode on another env var, etc. I asked a friend how big a problem this was on a scale of 1-10. I think he spoke for us all when he said: "Mostly a 1 or 2. Yesterday, it was an 11."

  • Examples:
    • Api.get(key: ENV["THE_KEY"]) will lead us to frustrating mysterious 401 errors when it isn't defined
    • Api.get(key: ENV.fetch("THE_KEY")) will raise the error, but now we're mole-whacking.
  • Doesn't Dotenv Fix It?: Sometimes. Dotenv has been a huge improvement but over time each developers local .env starts straying from the common .env.example and we get a lot of "it works on my machine" issues. Oh... and it's got nothing for secrets.

2. Scattered Defaults

Env vars are big global variables, and there isn't even a clear answer to where we put the values. Most codebases end up with a mix of defaults in the ENV invocation, some in .env files or maybe a .env.production file. Possibly a config/staging.yaml. Maybe something from our continuous deployment. Some things in a kubernetes configmap. It's a mess.

  • Examples:
    • .env.production using dotenv for deployed envs.
    • config/default.yaml or config/production.yaml YAML configs.
    • config.x.swarm_count = ENV.fetch('SWARM_COUNT', 3) in-line defaults.
    • config.x.configure_sys = !Rails.env.test? this looks like a config value but isn't actually updateable.
  • Issue: Defaults are inconsistently spread throughout the codebase, creating a chaotic and confusing setup.

3. No Types & Unsafe Interpolation

Speaking of chaotic mess, how much fun is it debugging an issue when your env var is a string but you're expecting a boolean? Or when you're expecting an array delimited on comma, but somebody left a space in it, and the env var isn't quoted someplace. Good times.

  • Examples:
    • config.x.use_seeds = ENV.fetch('USE_SEEDS', 'false') == 'true' (Potential boolean misinterpretation)
    • config.x.cors_origins = ENV.fetch('CORS_ORIGINS', '').split(',') (Complications with array parsing)
    • config.x.timeout_millis = ENV.fetch('TIMEOUT', '1') * 1000 (Potential for unit mismatches abound)
  • Issue: The lack of inherent type safety necessitates extra coding for handling data types, increasing the risk of errors.

4. What Value is it in Production?

How many times have you had to SSH into a production server to check the value of an environment variable? Or had to ask an ops person to do it for you? It's a pain, it's gross, it's a security risk. Environment variables: the really important configuration variables that you can't actually see or audit.

Partly, this is from scattered defaults, but mostly, this is from the complexity of the systems we've built to inject these variables and the lack of telemetry on their usage.

  • Issue: Assessing the environment variable values in production is cumbersome, requiring system access and specific commands.
  • Impact: This adds complexity to troubleshooting and configuration verification in live environments.

Why can't I use a CLI to see this? Why can't I just hover in my editor and see the configuration in each environment and the actual runtime values?

~/app (main)  $ prefab info
? Which item would you like to see? postgres.db.ip

- Default: 127.0.0.1
- Development: [inherit]
- Production: `POSTGRES_DB_IP` via ENV
- Staging: `POSTGRES_DB_IP` via ENV
- Test: [inherit]

Evaluations over the last 24 hours:

Production: 5
- 100% - 10.1.1.1

Staging: 2
- 100% - 10.11.12.13

Development: 25
- 100% - 127.0.0.1

No more ssh and printenv; I should just be able to do this from the comfort of home.

5. Refactoring Environment Variables is Terrible

Want to change an environment variable name? Good luck. Enjoy slacking everyone that they need to update their .env file in every repo.

Want to spin up a new application? Copy pasta the old .env around and let the duplication party begin.

Want to update the default across all your apps? Good luck.

  • Issue: Each .env is a massive duplication of our configuration, and this makes refactoring hard.
  • Impact: We get crufty code.

6. Cross Language Incompatibility

In truth, Rails has a decent story around all of this for a monolith. And various languages and frameworks have good approaches. But, what's that you say? You have a node app and a rails app? A Java app, too? And you'd like to... gasp... share a configuration value across them all? Sorry, mate, you're on your own.

  • Issue: Custom configuration libraries for each language create a lack of consistency and interoperability.
  • Impact: Lack of interoperability meets cut-overs to the new redis.uri need to happen on a per language basis and require understanding the configuration system (or systems) for each repository.

7. Question of Scale: How Many is Too Many?

How many environment variables is the right number? Ten or twenty is certainly fine. 100 sure feels like a lot and makes things ugly. 1000? More? No, thank you.

But... how many aspects of my system would I like to be configurable? Well, if you take off the shackles of having to jam everything into an env var, I suppose I'd actually like to configure lots of things. Should my http timeout be the same for every single request? Actually, I’d like to tune that at a fine-grained level. But I sure as heck am not going to do that if there is one env var per config. TIMEOUT_AUTH_SERVICE_FROM_BILLING_SERVICE=5000 is madness.

  • Issue: The way environment variables work fundamentally encourages a small number of variables, which is at odds with the desire to have a highly configurable system.
  • Impact: We build systems and libraries without as many knobs and levers as we'd like, and this limits our options for real-time adjustments to production issues.

8. Updates: Slow and Forgettable

Most places I would expect an hour or two. Yes that's crazy, but yes that's the reality. Usually this is a ticket into your devops team and then they have to go update the value in a configmap or something. (I will admit that if you're on heroku this probably takes 1 minute. This is how it should be!)

Changing a variable should be instant, but we have these variables locked into a system that, for most of us, is slow to update.

  • Issue: Updating environment variables can be time-consuming, particularly in larger and more complex systems.
  • Impact: Slow MTTR when issues could be fixed by configuration changes.

9. Secrets Management Requires a Different System

Secrets are just configuration too, or they should be, albeit with more permissions and confidentiality. However, our code needs to know the values just like it would any other variable. Instead, almost all of us have to operate two totally separate tools/processes for managing secrets and configuration.

  • Issue: Managing sensitive data often requires a separate system from standard environment variables, adding to the complexity of configuration management.
Secrets and config should live next to each other

I should be able to see all my configuration in one place, secrets, too. Sure, secrets are confidential and should be encrypted, but that doesn't mean I shouldn't be able to understand that my applications are using them.

Conclusion

Environment variables have got us a long way, but we can do better, and indeed, lots of organizations have built sophisticated dynamic configuration systems that address all of these issues. The future just isn't evenly distributed. Or... hasn't been until now.

The key elements of a better system are:

  1. A single view of all of my configuration
  2. Typed values like: string, bool, duration, arrays, etc.
  3. Defaults that are easy to override for local dev
  4. Easy to share configuration between projects
  5. Telemetry on what values are actually being used in production
  6. Interoperability with Terraform / IaaS / Kubernetes / Existing Secrets Management
  7. A system that supports secrets as well as configuration

As I said, to my knowledge, the best examples of systems that support all this typically come from internal tools at large companies. HubSpot talks briefly about their in How we deploy 300 times a day. Amplitude covers the architecture decisions of theirs in Using DynamoDB for Dynamic Configuration and Netflix's open source Archaius has a lot of the underpinning pieces, though no help on the UI. And, of course, we have Prefab, which is our attempt to bring this to the world.

What's Next?

I think we're a fair way along this journey here at Prefab, and we're excited to share what we've learned and what we've built. I'd love you to check out our dynamic configuration and let me know what you think.

To a world of better config for all 🚀

Before You Lograge

· 16 min read
Jeff Dwyer
Jeff Dwyer
Prefab Founder & Engineer

Lograge is one of the all-time great Rails gems and is one of those 3-4 gems like devise, timecop or rails_admin that I typically install on every new Rails project.

So, lograge is great, but are better alternatives in 2024? I think so. We'll examine two options: an excellent free choice called Rails Semantic Logger and one I've built for the Prefab platform.

What Problem Do These Gems Solve?

First, let's take a quick look at what problem we're trying to solve. Here's the logging you get from Rails & Lograge out of the box at info level.

Started GET "/posts" for 127.0.0.1 at 2023-09-06 10:08:20 -0400
Processing by PostsController#index as HTML
Rendered posts/index.html.erb within layouts/application (Duration: 0.8ms | Allocations: 813)
Rendered layout layouts/application.html.erb (Duration: 19.3ms | Allocations: 34468)
Completed 200 OK in 30ms (Views: 21.1ms | ActiveRecord: 0.5ms | Allocations: 45960)

There are a number of annoyances with the Rails logging defaults:

  1. 5 lines of logging for a single request.
  2. "Completed 200 OK" doesn't tell us which request it was that completed.
  3. No timestamps on the log lines after the first one.

In contrast, lograge is clear, concise & grep-able.

(You can, of course, output in JSON as well; I'm not showing that because it's not as pleasant to look at.)

So this is the problem that lograge has been solving all these years, and it's a great fix.

More Than Just a Single Line

But, a single-line request summary is not the only interesting aspect of logging. What about debug logging? What about tagged and struct logging? Can any of these libraries help us fix our problems faster?

To exercise the other aspects of logging, here's the sample code we will run. It logs at all four levels and uses tagged and structlog to show how to add context to your logs.

class PostsController < ApplicationController
def index
@posts = Post.all
if can_use_struct_log?
logger.debug "🍏🍏🍏detailed information", posts: @posts.size #struct logging
logger.info "🍋🍋🍋informational logging", posts: @posts.size
else
logger.debug "🍏🍏🍏detailed information #{@posts.size}" # old-school
logger.info "🍋🍋🍋informational logging #{@posts.size}"
end
@posts.first.process_post
end
end

class Post < ApplicationRecord
def process_post
logger.tagged "process post" do
logger.tagged "post-#{id}" do #nested tagged logging
logger.debug "🍏🍏🍏details of the post"
logger.info "🍋🍋🍋 info about the post"
end
end
end
end

Comparing At INFO Level

Let's compare the output at the info level for each of the gems. It is a bit funky to see it on the web and not a wide terminal, but we'll do our best. Each of the gems does provide a way to provide a custom formatter to tweak things like date, time, etc, but this is what you get out of the box. Also, you'll probably want to use JSON output in production. All the gems support that; see the JSON output comparison in the appendix, but it's pretty straightforward.

Started GET "/posts" for 127.0.0.1 at 2023-09-06 10:08:20 -0400
Processing by PostsController#index as HTML
🍋🍋🍋informational logging 1
[process post] [post-2] 🍋🍋🍋 info about the post
Rendered posts/index.html.erb within layouts/application (Duration: 0.8ms | Allocations: 813)
Rendered layout layouts/application.html.erb (Duration: 19.3ms | Allocations: 34468)
Completed 200 OK in 30ms (Views: 21.1ms | ActiveRecord: 0.5ms | Allocations: 45960)

We see that Rails, by default, has no support for structured logging, though it does support tagged logging. We're outputting logging 1 instead of logging posts=1 and in JSON we won't have a nice {"posts": 1} to index.

It's also not clear what class or file informational logging 1 is coming from. This is annoying because it makes us need to type more detail into the error message just to help us locate / grep.

We do see helpful logging about what templates were rendered and how long they took.

Comparing At DEBUG Level

For completeness, let's compare the output at the debug level for each of the gems.

Started GET "/posts" for 127.0.0.1 at 2023-09-06 10:01:55 -0400
Processing by PostsController#index as HTML
Post Count (0.0ms) SELECT COUNT(*) FROM "posts"
↳ app/controllers/posts_controller.rb:8:in `index'
🍏🍏🍏detailed information 1
CACHE Post Count (0.0ms) SELECT COUNT(*) FROM "posts"
↳ app/controllers/posts_controller.rb:9:in `index'
🍋🍋🍋informational logging 1
CACHE Post Count (0.0ms) SELECT COUNT(*) FROM "posts"
↳ app/controllers/posts_controller.rb:10:in `index'
CACHE Post Count (0.0ms) SELECT COUNT(*) FROM "posts"
↳ app/controllers/posts_controller.rb:11:in `index'
Post Exists? (0.1ms) SELECT 1 AS one FROM "posts" LIMIT ? [["LIMIT", 1]]
↳ app/controllers/posts_controller.rb:12:in `index'
Post Load (0.0ms) SELECT "posts".* FROM "posts" ORDER BY "posts"."id" ASC LIMIT ? [["LIMIT", 1]]
↳ app/controllers/posts_controller.rb:13:in `index'
[process post] [post-2] 🍏🍏🍏details of the post
[process post] [post-2] 🍋🍋🍋 info about the post
Rendering layout layouts/application.html.erb
Rendering posts/index.html.erb within layouts/application
Post Load (0.1ms) SELECT "posts".* FROM "posts"
↳ app/views/posts/index.html.erb:4
Rendered posts/index.html.erb within layouts/application (Duration: 0.6ms | Allocations: 736)
Rendered layout layouts/application.html.erb (Duration: 7.9ms | Allocations: 14135)
Completed 200 OK in 15ms (Views: 8.4ms | ActiveRecord: 0.6ms | Allocations: 20962)

Rails debug for local dev gets pretty chatty with a lot more detail. In addition to the templates and layouts we got at the debug level, we can now see the executed SQL.

We also now get class and line number output for some of the logging, though not all of it. Our custom logging does not include any information about where it came from.

It's also a lot of output, and it's not particularly easy to grep for the important bits. As your app grows, this logging can start to get a bit overwhelming.

It may go without saying, but turning this on in production would be a very bad idea.

JSON Formatting

The JSON formatting of each of these libraries is pretty much what you would expect, but for completeness:

{
"method":"GET",
"path":"/posts",
"format":"html",
"controller":"PostsController",
"action":"index",
"status":200,
"allocations":45961,
"duration":37.91,
"view":29.63,
"db":0.42
}

Summary

The state of Rails logging gems in 2024 is good, and you've got great options. If you've been defaulting to just standard Rails logging or lograge for years, it may be time to take a look at what else is out there. Being able to quickly trace each log line back to its source is valuable, and structured logging feels much better than string interpolation and can be very powerful in conjunction with your log aggregation tool.

Rails Default Logger

Good:

  • Rails gives us a lot of great information out of the box.

Bad:

  • 5 lines of logging for a single request is too much in deployed environments.
  • "Completed 200 OK" doesn't tell us what request completed.
  • No timestamps on the log lines after the first one.
  • Difficult to fine-tune debug logging. Very "all-or-nothing".

Lograge

Lograge has been the default choice for years. If you don't use much logging and just want the basic request log, it's a good choice.

For more information, check out the GitHub for lograge

Good

  • Better 1-line Req Log
  • Supports tagged logging

Bad

  • No support for struct log
  • Unclear display of level by default formatter
  • Difficult to fine-tune debug logging
  • Doesn’t format your other logs, like Rails.logger.info "foo"
  • No file names/origin of logging

rails_semantic_logger

Rails Semantic Logger is an impressive piece of software that has been around for a long time. It's got a lot of features and is very configurable. It has everything you could want in a logger, save the ability to update it dynamically.

For more information, check out the docs for rails_semantic_logger

Good:

  • Adds Class Name
  • Optionally add file and line number
  • Better 1-line Req Log
  • Very configurable
  • Structlog & Tagged Logging
  • logger.measure_trace("Low level trace information such as data sent over a socket") do ... end is cool
  • logger.error("Oops external call failed", exception) is cool

Bad:

  • Can't change log levels on the fly
tip

Since this was published, prefab-cloud-ruby has switched to work as a filter for rails_semantic_logger. That means you can have your cake and eat it too! Just add SemanticLogger.add_appender(filter: Prefab.log_filter) and you can get the best of both worlds. Read Dynamic Ruby Log Levels With Semantic Logger & Prefab for details.

prefab-cloud-ruby

Prefab is a SaaS that provides dynamic configuration and uses that to support Feature Flag and Dynamic Log Levels. Prefab provides the same log cleanup and core features as SemanticRails, with the additional benefit of being able to quickly debug production by temporarily enabling debug logging for a specific user or job.

For more information, check out: Dynamic Log Levels

Good

  • Consistent display of class and method
  • Change log level instantly
  • Turn debugging logging on for just a single user or team
  • Better 1-line Req Log
  • Structlog & Tagged Logging

Bad

  • Not as comprehensive as rails_semantic_logger
  • Fewer integrations than rails_semantic_logger or lograge
  • Part of a paid product

Thanks for checking this out. If you have any questions, please reach out.

Feature Flags in VSCode

· 3 min read
Jeff Dwyer
Jeff Dwyer
Prefab Founder & Engineer

We're super excited about our new Editor Tools! When Jeffrey first starting hacking around with the LSP we each had one of those whoa moments where you feel like you're seeing things in a whole new light.

I love being in my editor, but everything about Feature Flags has always required me to leave. We spent the past month asking "what would it be like to do it all from the editor?" and I love where we ended up.

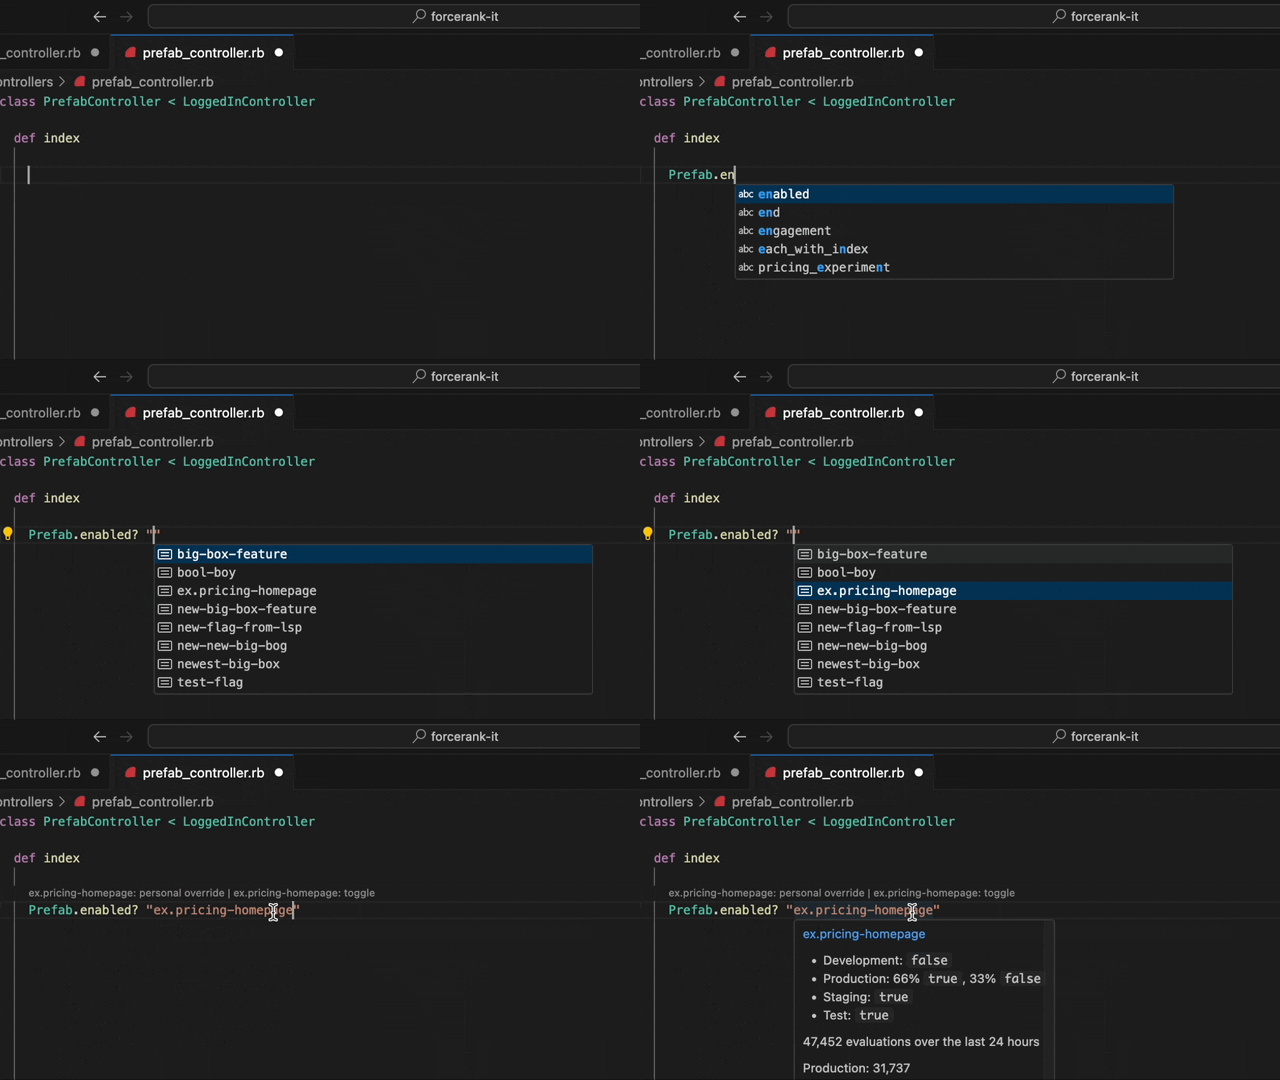
Feature Flag Autocompletion

First up, the autocomplete feature for feature flags. A mistyped feature flag is a terrible thing and pretty annoying to debug since they default to false. Let your editor help with that. Autocomplete for flag and config names, and auto-create simple flags if the flag doesn't exist yet.

Feature Flag autocomplete

Evaluations on Hover

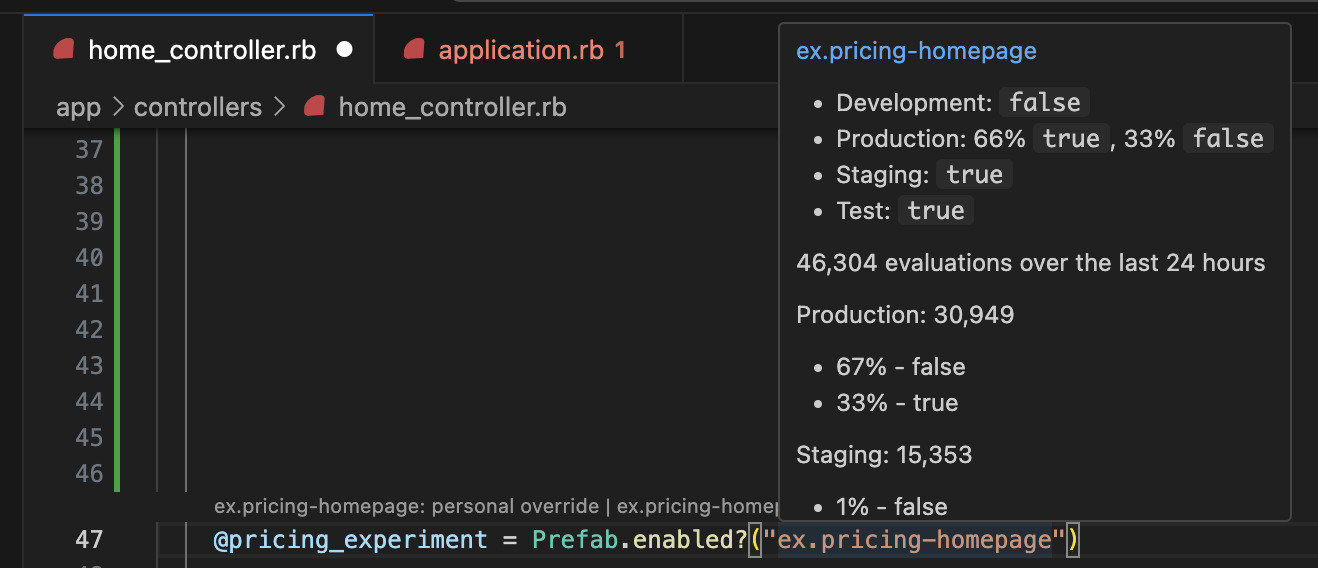
Writing the feature flag is often the easy part. The real question comes later. Is this thing on? Can I delete it? What value is set in production?

We wondered how excellent it would be to bring our evaluation data right into the editor and our answer is... very excellent! No more leaving your editor to answer a simple question. A simple hover, and you’ve got all the info you need.

Feature Flag in Editor Evaluation Summaries

In this picture you can see that the flag is true in staging and test, false in dev and a 66% rollout to true in production. And it looks like it's working too. Data over the past 24 hours shows that 67% of users are seeing the feature.

Personal Overrides

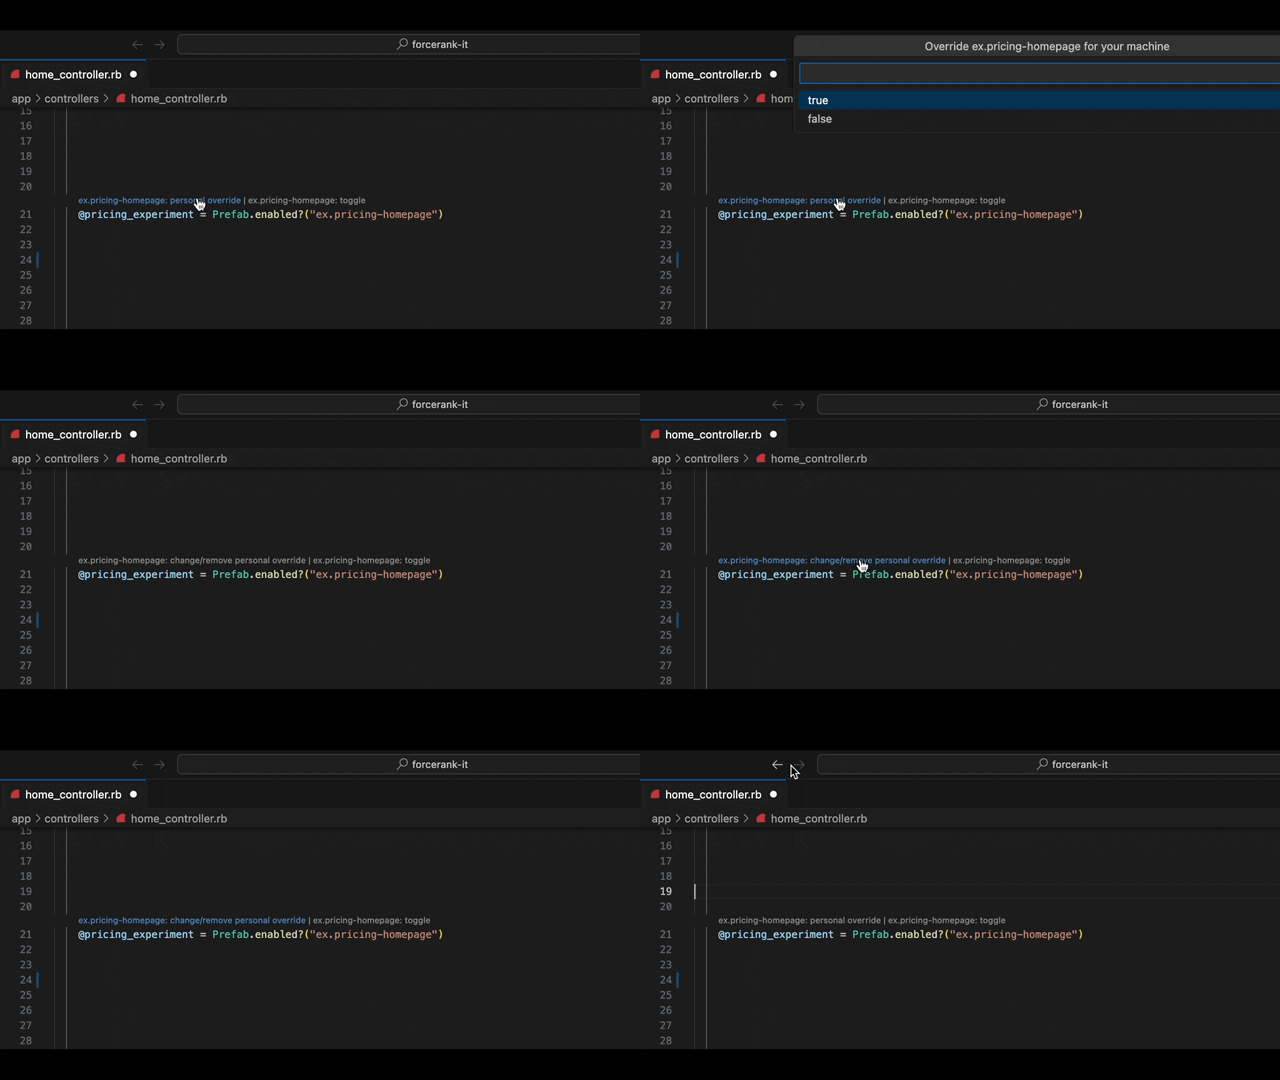
Grimace if you've ever committed if true || flags.enabled? "myflag" to version control. It's easy to do. You want to see what happens when a flag is enabled, but setting the flag is annoying or will change it for everyone, so you cheat and put a raw true in front of your flag and then forget to take it out.

What would be a better way? Well, could I just click on the flag and set it to true? Of course it should only be true for me on my personal machine so I don't screw anyone else up. That sounds nice right?

Feature Flag in Editor Evaluation Summaries

This personal overrides feature is tied to you developer account, so no more global toggles causing chaos. Set your value, test your feature, all without leaving your coding groove.

Learning More About LSPs

We've been learning a ton about Language Server Protocols (LSPs) lately. Jeffrey's been on a roll, sharing his insights on creating LSPs with tutorials like writing an lsp in bash and lsp zero to completion.

We're not just building these tools for you; we're building them for us, too. We're genuinely jazzed about these new features and the difference they're making in our coding lives.

Give these new tools a spin and let us know what you think. We'd love to hear about what else you think would make the in-editor experience for feature flags brilliant. Don't use VSCode? Don't worry, we're working on the other editors too. Go here to get notified about new editor releases.

LSP: Writing a Language Server in Bash

· 7 min read
Jeffrey Chupp
Jeffrey Chupp
Prefab Founding Engineer. Three-time dad. Polyglot. I am a pleaser. He/him.

Implementing a language server is so easy that we're going to do it in Bash.

You really shouldn't write your language server in Bash, but we'll show that you could.

The minimum viable language server needs to

  1. receive JSON-RPC requests from the client
  2. respond with JSON-RPC to client requests

Like a good bash program, we'll talk over stdin and stdout.

Mad scientist holding a bash language server

JSON-RPC

JSON-RPC is simply a protocol for communication over JSON.

  • A request message includes an id, params, and the method to be invoked.
  • A response message includes the id from the request and either a result or error payload.
  • The LSP adds on the additional requirement of a header specifying the Content-Length of the message.

An example request might look like

Content-Length: 226\r\n
\r\n
{"jsonrpc":"2.0","method":"initialize","id":1,"params":{"trace":"off","processId":2729,"capabilities":[],"workspaceFolders":null,"rootUri":null,"rootPath":null,"clientInfo":{"version":"0.10.0-dev+Homebrew","name":"Neovim"}}}

An example response might look like

Content-Length: 114\r\n
\r\n
{
"jsonrpc": "2.0",
"id": 1,
"result": {
"capabilities": {
"completionProvider": {}
}
}
}

For our language server in bash, we'll write the following function:

respond() {
local body="$1"
local length=${#body}
local response="Content-Length: $length\r\n\r\n$body"

echo -e "$response"
}

This will take a JSON string as an argument and echo it out. The -e ensures our line breaks work as intended.

Listening for messages and parsing them

Our language server will listen for messages on stdin and write messages on stdout.

Let's name the bash script /tmp/bash-ls and chmod +x it.

I'll connect it to my editor, Neovim, using

vim.lsp.start {
name = "Bash LS",
cmd = {"/tmp/bash-ls"},
capabilities = vim.lsp.protocol.make_client_capabilities(),
}

Now, we'll work on our read/print loop.

We'll start with the Bash classic

while IFS= read -r line; do

This gives us a value for $line that looks like Content-Length: 3386

The content length will vary based on the capabilities of your editor, but the gist here is that we need to read 3386 characters to get the entire JSON payload.

Let's extract the content length number

while IFS= read -r line; do
# Capture the content-length header value
[[ "$line" =~ ^Content-Length:\ ([0-9]+) ]]
length="${BASH_REMATCH[1]}"

We need to add 2 to the number to account for the initial \r after the content length header. So we'll length=$((length + 2))

Now we're ready to read the JSON payload:

while IFS= read -r line; do
# Capture the content-length header value
[[ "$line" =~ ^Content-Length:\ ([0-9]+) ]]
length="${BASH_REMATCH[1]}"

# account for \r at end of header
length=$((length + 2))

# Read the message based on the Content-Length value
json_payload=$(head -c "$length")

Remember that JSON-RPC requires us to include the id of the request message in our response. We could write some convoluted JSON parsing in bash to extract the id, but we'll lean on jq instead.

while IFS= read -r line; do
# Capture the content-length header value
[[ "$line" =~ ^Content-Length:\ ([0-9]+) ]]
length="${BASH_REMATCH[1]}"

# account for \r at end of header
length=$((length + 2))

# Read the message based on the Content-Length value
json_payload=$(head -c "$length")

# We need -E here because jq fails on newline chars -- https://github.com/jqlang/jq/issues/1049
id=$(echo -E "$json_payload" | jq -r '.id')

Now, we have everything we need to read and reply to our first message.

The initialize method

The first message sent by the client is the initialize method. It describes the client's capabilities to the server.

You can think of this message as saying, "Hey, language server, here are all the features I support!"

The server replies with, "Oh, hi, client. Given the things you support, here are the things I know how to handle."

Well, that's how it should work, anyway. For our MVP here, we'll provide a canned response with an empty capabilities section.

while IFS= read -r line; do
# Capture the content-length header value
[[ "$line" =~ ^Content-Length:\ ([0-9]+) ]]
length="${BASH_REMATCH[1]}"

# account for \r at end of header
length=$((length + 2))

# Read the message based on the Content-Length value
json_payload=$(head -c "$length")

# We need -E here because jq fails on newline chars -- https://github.com/jqlang/jq/issues/1049
id=$(echo -E "$json_payload" | jq -r '.id')
method=$(echo -E "$json_payload" | jq -r '.method')

case "$method" in
'initialize')
respond '{
"jsonrpc": "2.0",
"id": '"$id"',
"result": {
"capabilities": {}
}
}'
;;

*) ;;
esac
done

We pluck out the request's method and use a case statement to reply to the correct method. If we don't support the method, we don't respond to the client.

If we didn't use a case statement here and always replied with our canned message, we'd make it past initialization, but then the client would get confused when we respond to (e.g.) its request for text completions with an initialize result.

That's all you need for a minimum viable language server built-in bash. It doesn't do anything besides the initialization handshake, but it works.

Adding completion

A language server that doesn't do anything is no fun, so let's teach it how to respond to textDocument/completion to offer text completions.

First, we'll need to modify our capabilities in our initialize response to indicate that we support completion:

          "result": {
"capabilities": {
"completionProvider": {}
}
}

We'll start with hardcoded results to verify things work. This is as easy as adding a new condition to our case statement.

  'textDocument/completion')
respond '{
"jsonrpc": "2.0",
"id": '"$id"',
"result": {
"isIncomplete": false,
"items": [
{ "label": "a sample completion item" },
{ "label": "another sample completion item" }
]
}
}'
;;
Hardcoded completions

That works as we hoped. Let's jazz it up a little by completing the first 1000 words from the dict file on macOS (your path may differ).

Here's the final version of the script:

#!/bin/bash

respond() {
local body="$1"
local length=${#body}
local response="Content-Length: $length\r\n\r\n$body"

echo "$response" >>/tmp/out.log

echo -e "$response"
}

completions=$(head </usr/share/dict/words -n 1000 | jq --raw-input --slurp 'split("\n")[:-1] | map({ label: . })')

while IFS= read -r line; do
# Capture the content-length header value
[[ "$line" =~ ^Content-Length:\ ([0-9]+) ]]
length="${BASH_REMATCH[1]}"

# account for \r at end of header
length=$((length + 2))

# Read the message based on the Content-Length value
json_payload=$(head -c "$length")

# We need -E here because jq fails on newline chars -- https://github.com/jqlang/jq/issues/1049
id=$(echo -E "$json_payload" | jq -r '.id')
method=$(echo -E "$json_payload" | jq -r '.method')

case "$method" in
'initialize')
respond '{
"jsonrpc": "2.0",
"id": '"$id"',
"result": {
"capabilities": {
"completionProvider": {}
}
}
}'
;;

'textDocument/completion')
respond '{
"jsonrpc": "2.0",
"id": '"$id"',
"result": {
"isIncomplete": false,
"items": '"$completions"'
}
}'
;;

*) ;;
esac
done
Dictionary completions

Lovely.

Closing

In 56 lines of bash, we've implemented a usable (if boring) language server.

I wouldn't advocate anyone writing a serious language server in bash. Hopefully, this has illustrated how easy it is to get started with language servers and has made the LSP and JSON-RPC a little less magical.

What language would I recommend for writing a language server? That's probably a whole article in itself, but the short answer is

  1. All things being equal, choose TypeScript. The first-party libraries (e.g., vscode-languageserver-node) are in written TypeScript, and the community and ecosystem are excellent.
  2. If you don't want to use TypeScript, use whatever language you're most productive in. There's probably already a library for writing a language server in your preferred language, but if there isn't, you now know how easy it is to write it yourself.

If you'd like to be notified when I publish more LSP content, sign up for my newsletter.

How to Use Feature Flags in React

· 5 min read
Andrew Yip
Andrew Yip
Prefab Founding Designer

This post will walk you through setting up Prefab feature flags in your React app, and creating a flag for a gradual rollout of a new feature.

Creating a feature flag in the Prefab dashboard

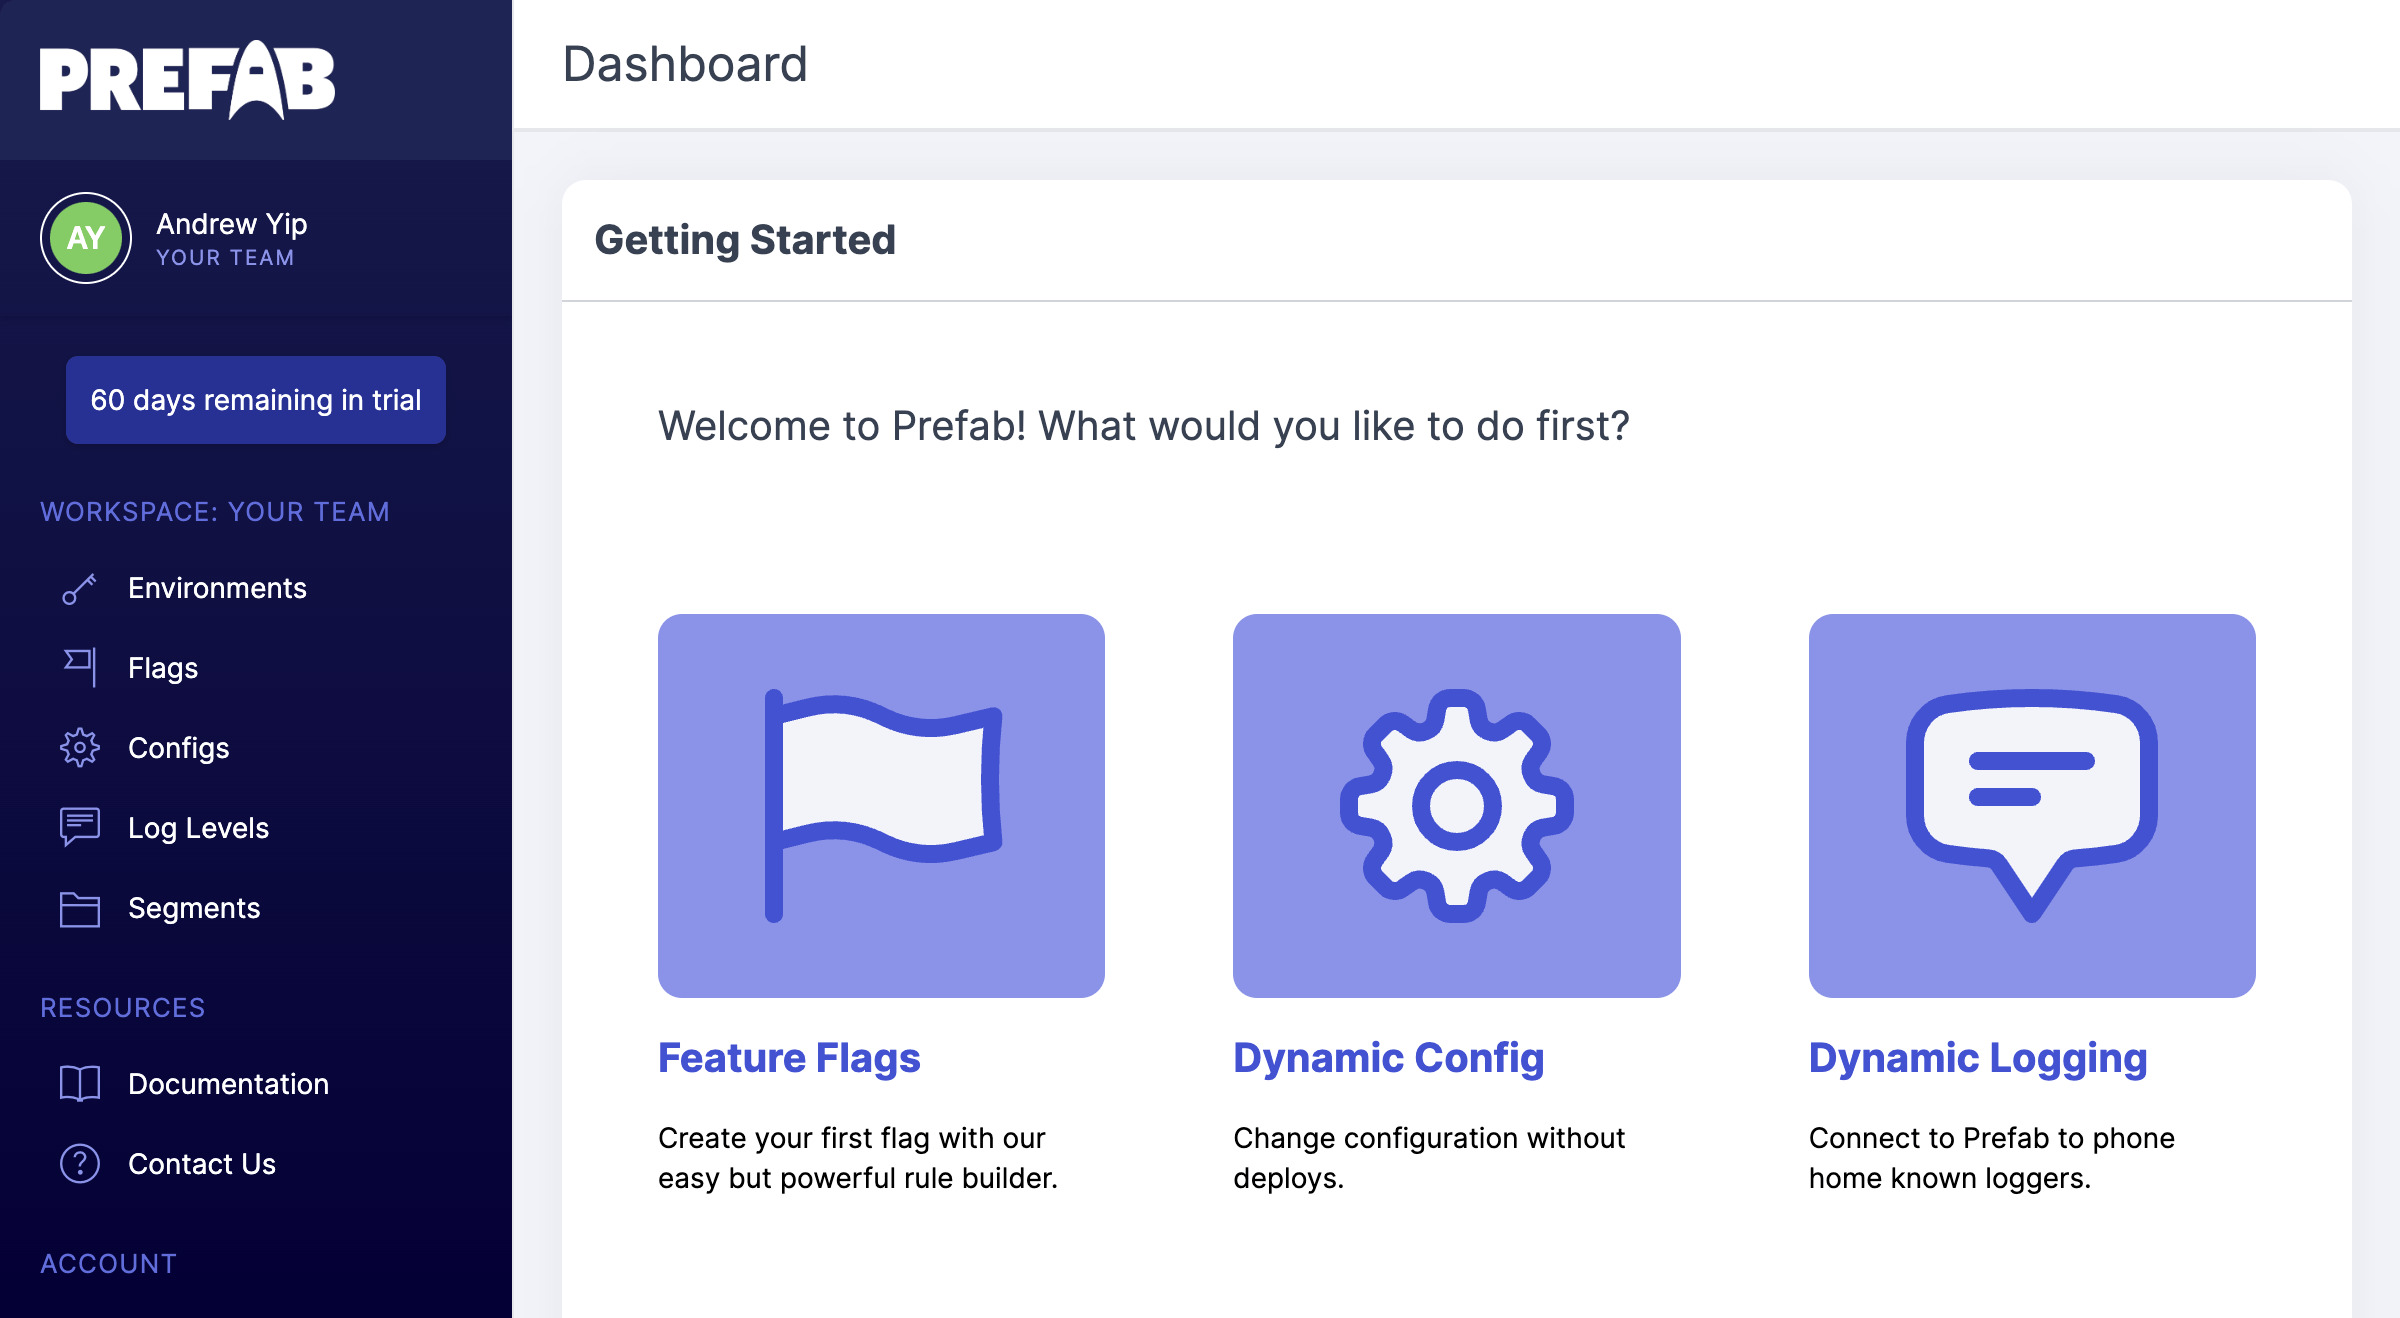
If you don't have one already, start by creating a free Prefab account. Once you sign in, this is what you'll see

Prefab dashboard

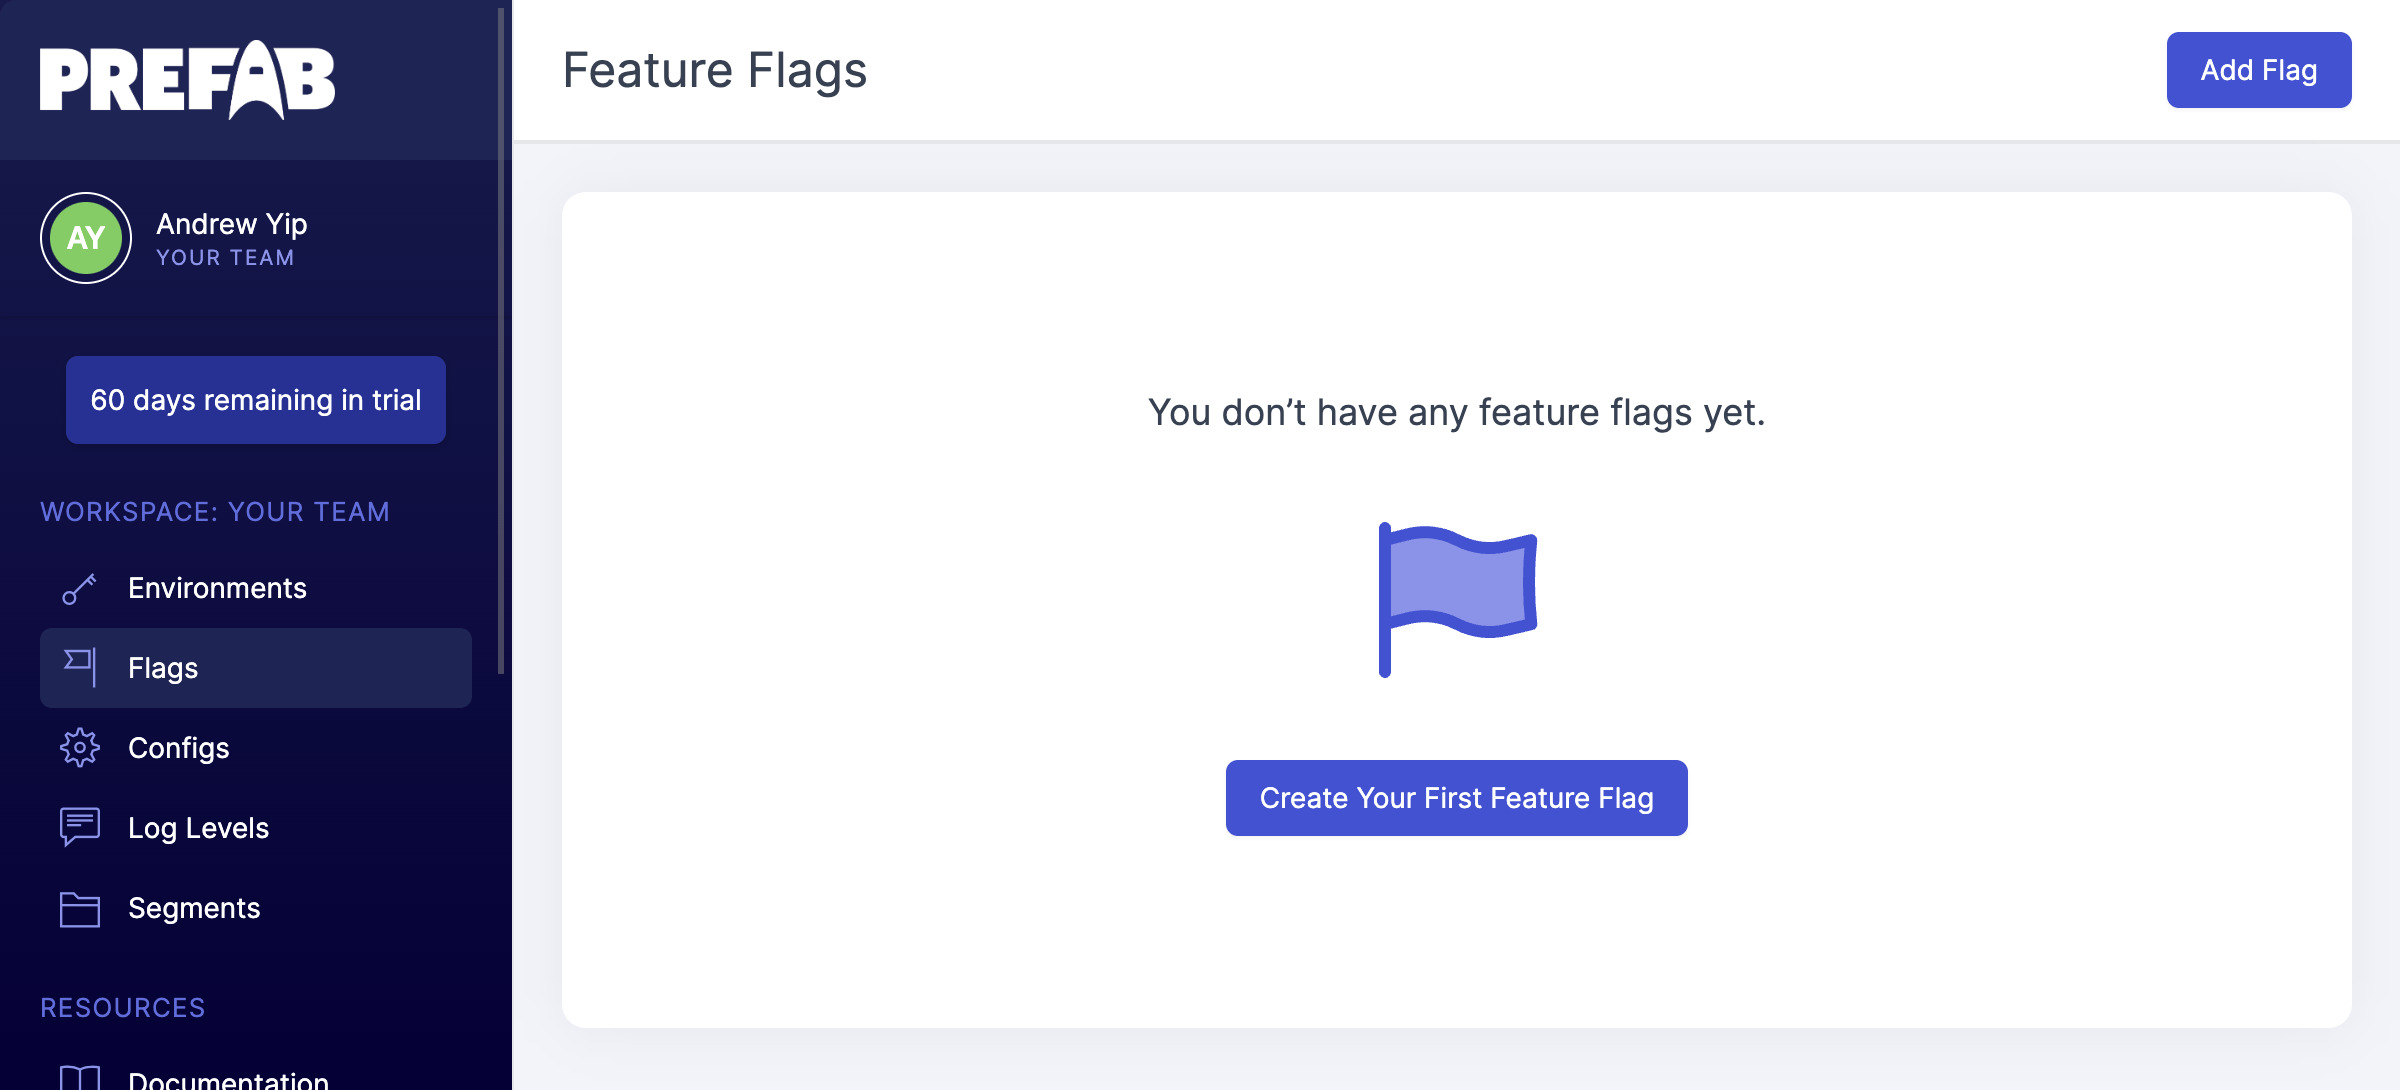
To create your first feature flag, click on Flags in the left nav and you'll be brought to the Flags index page.

Prefab new feature flag page

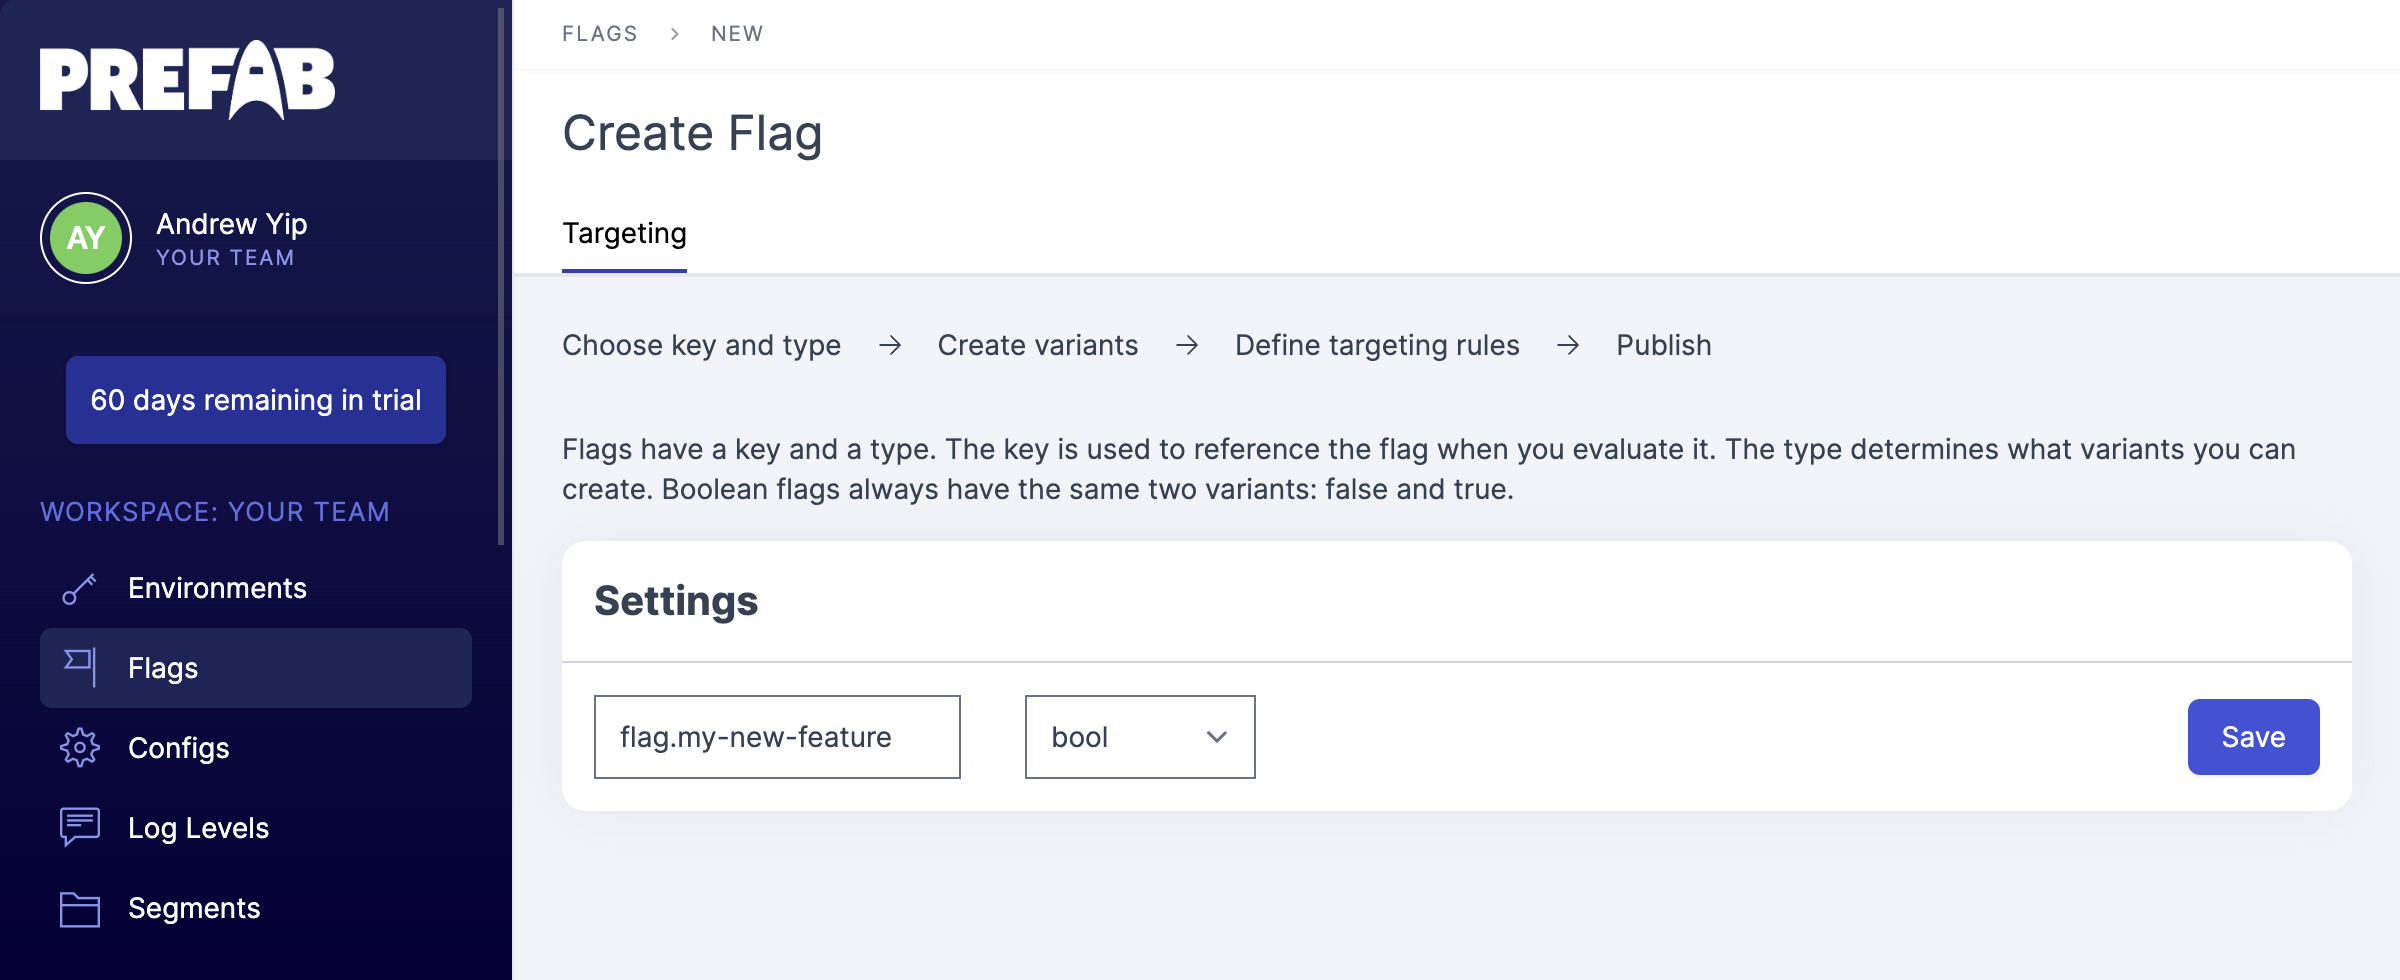
Click Add Flag to create your first flag. We'll name it flag.my-new-feature and leave the type as bool, then click Save.

Prefab feature flag settings

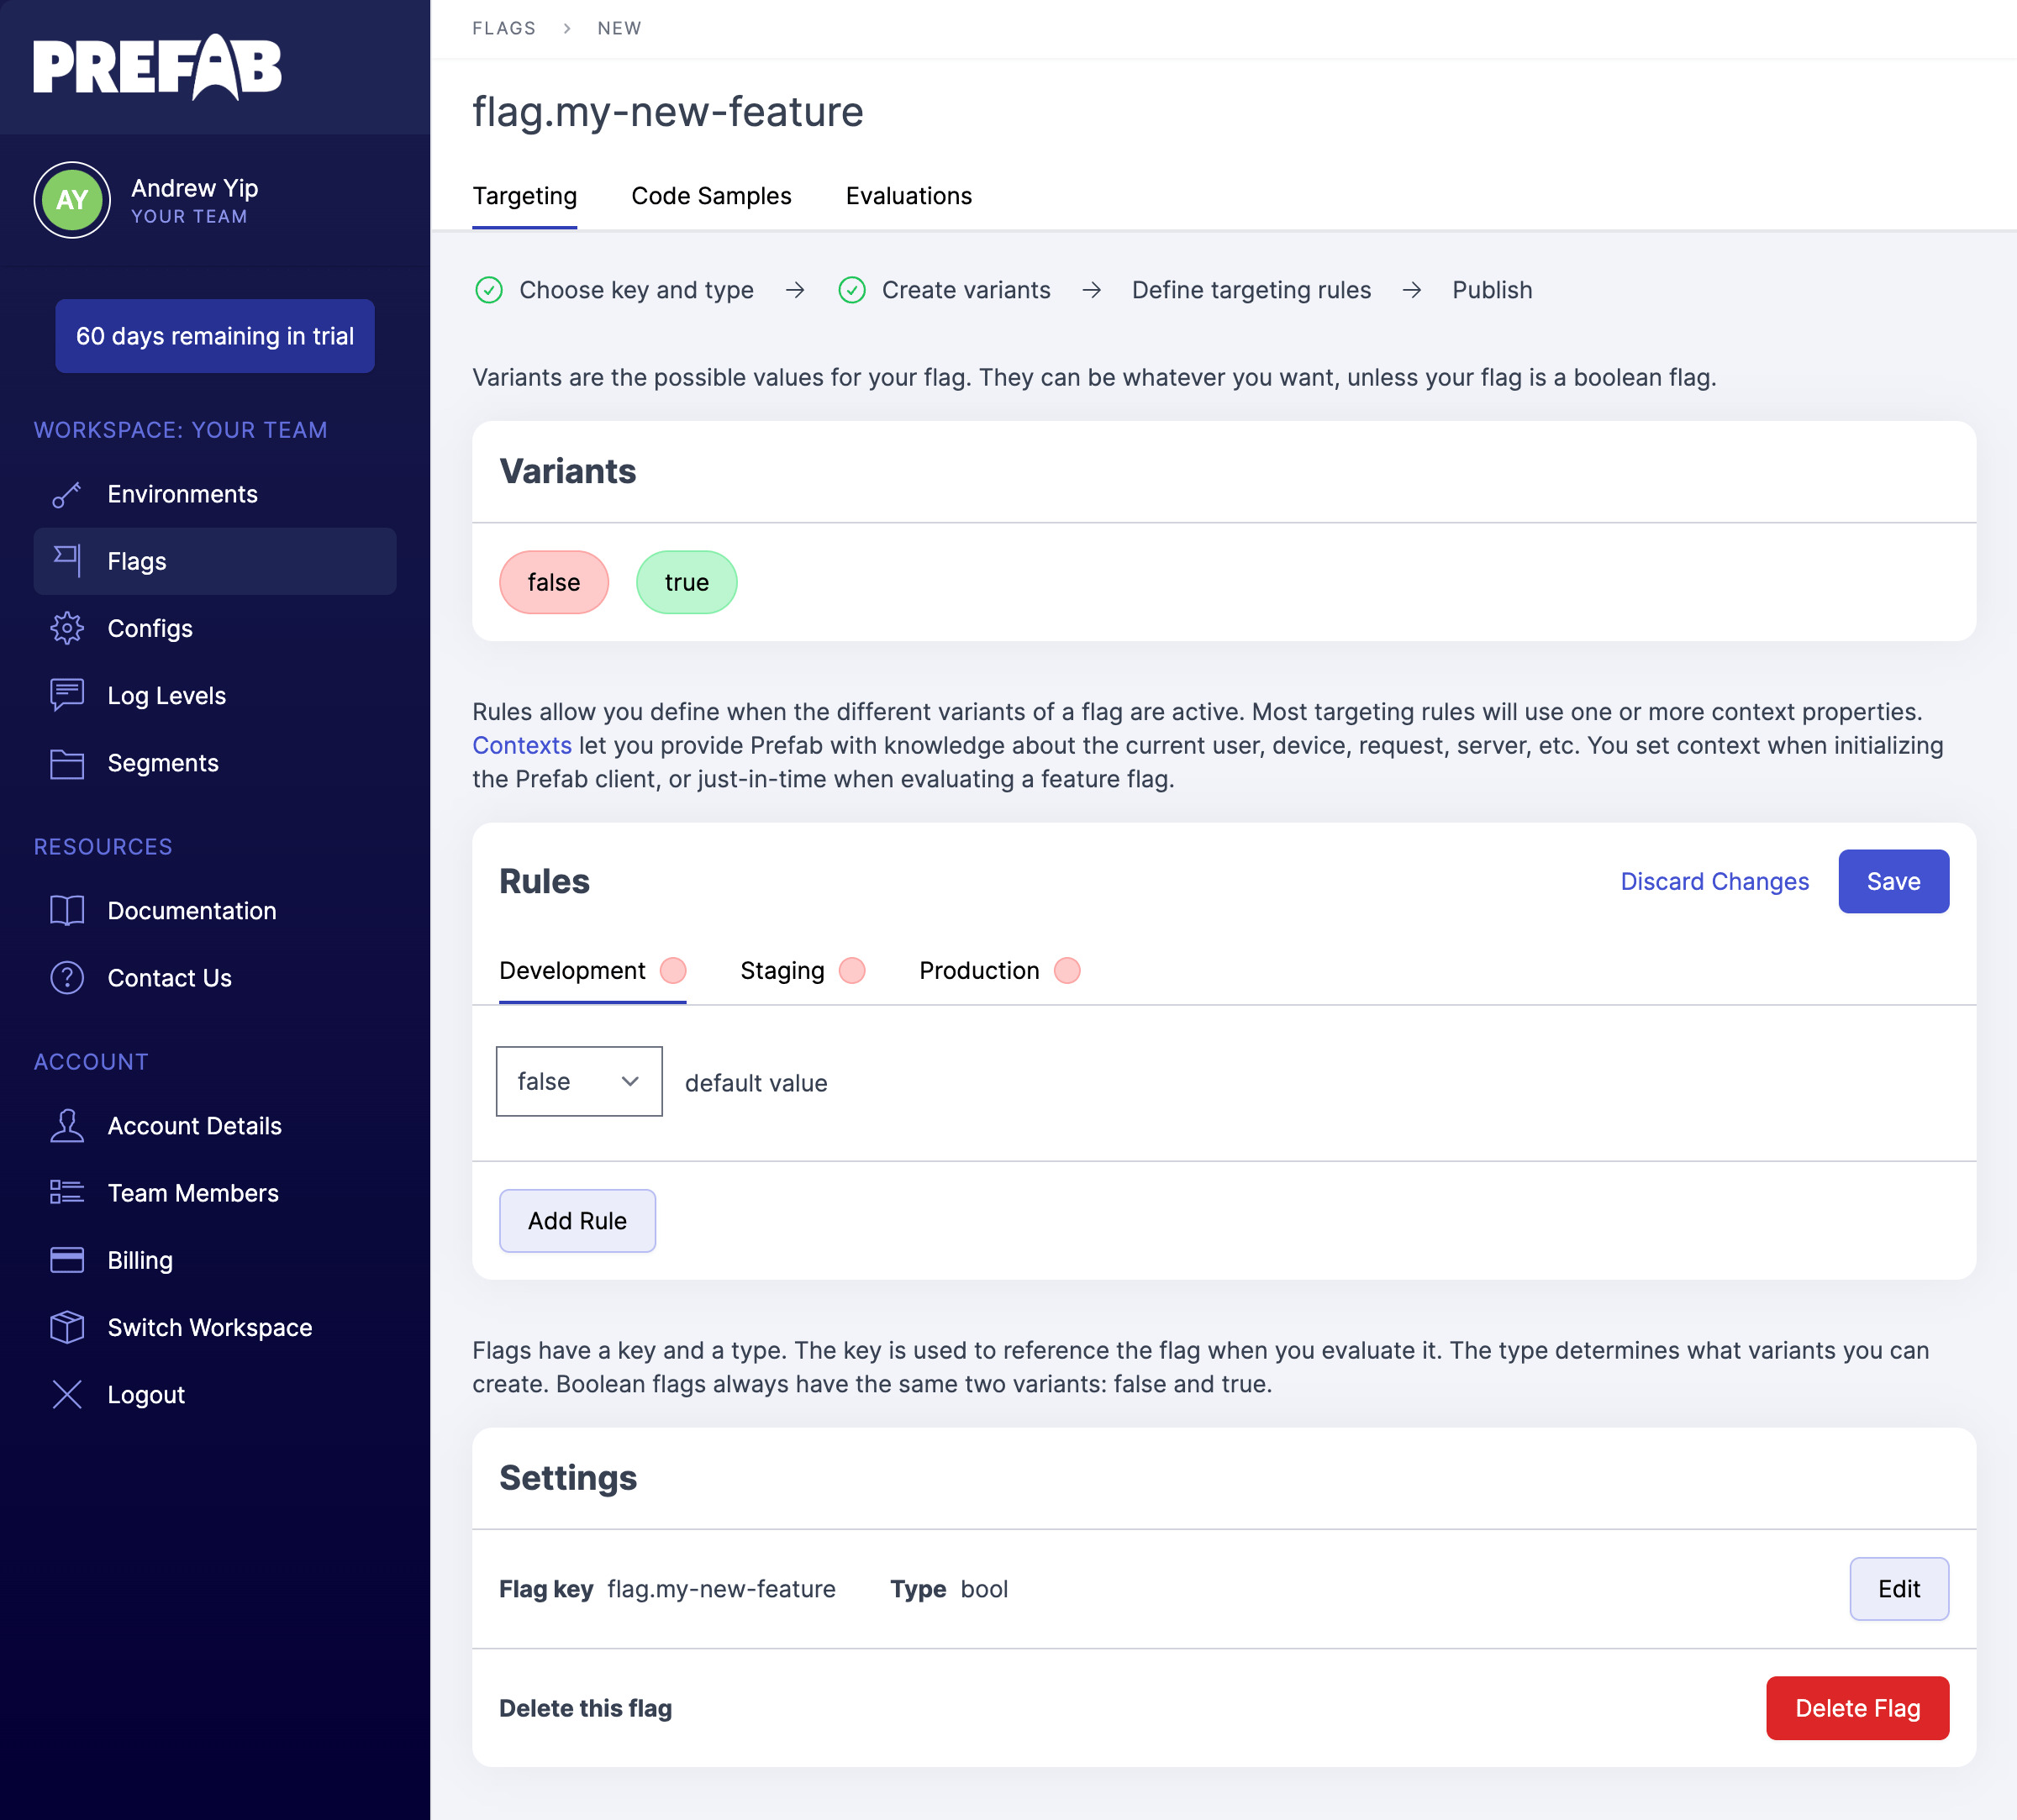
Once you Save the flag name, you'll see the flag Variants and flag Rules. Since this is a boolean flag, the variants aren't editable, but for other flag types such as string you can name as many variants as you want.

Prefab feature flag rules

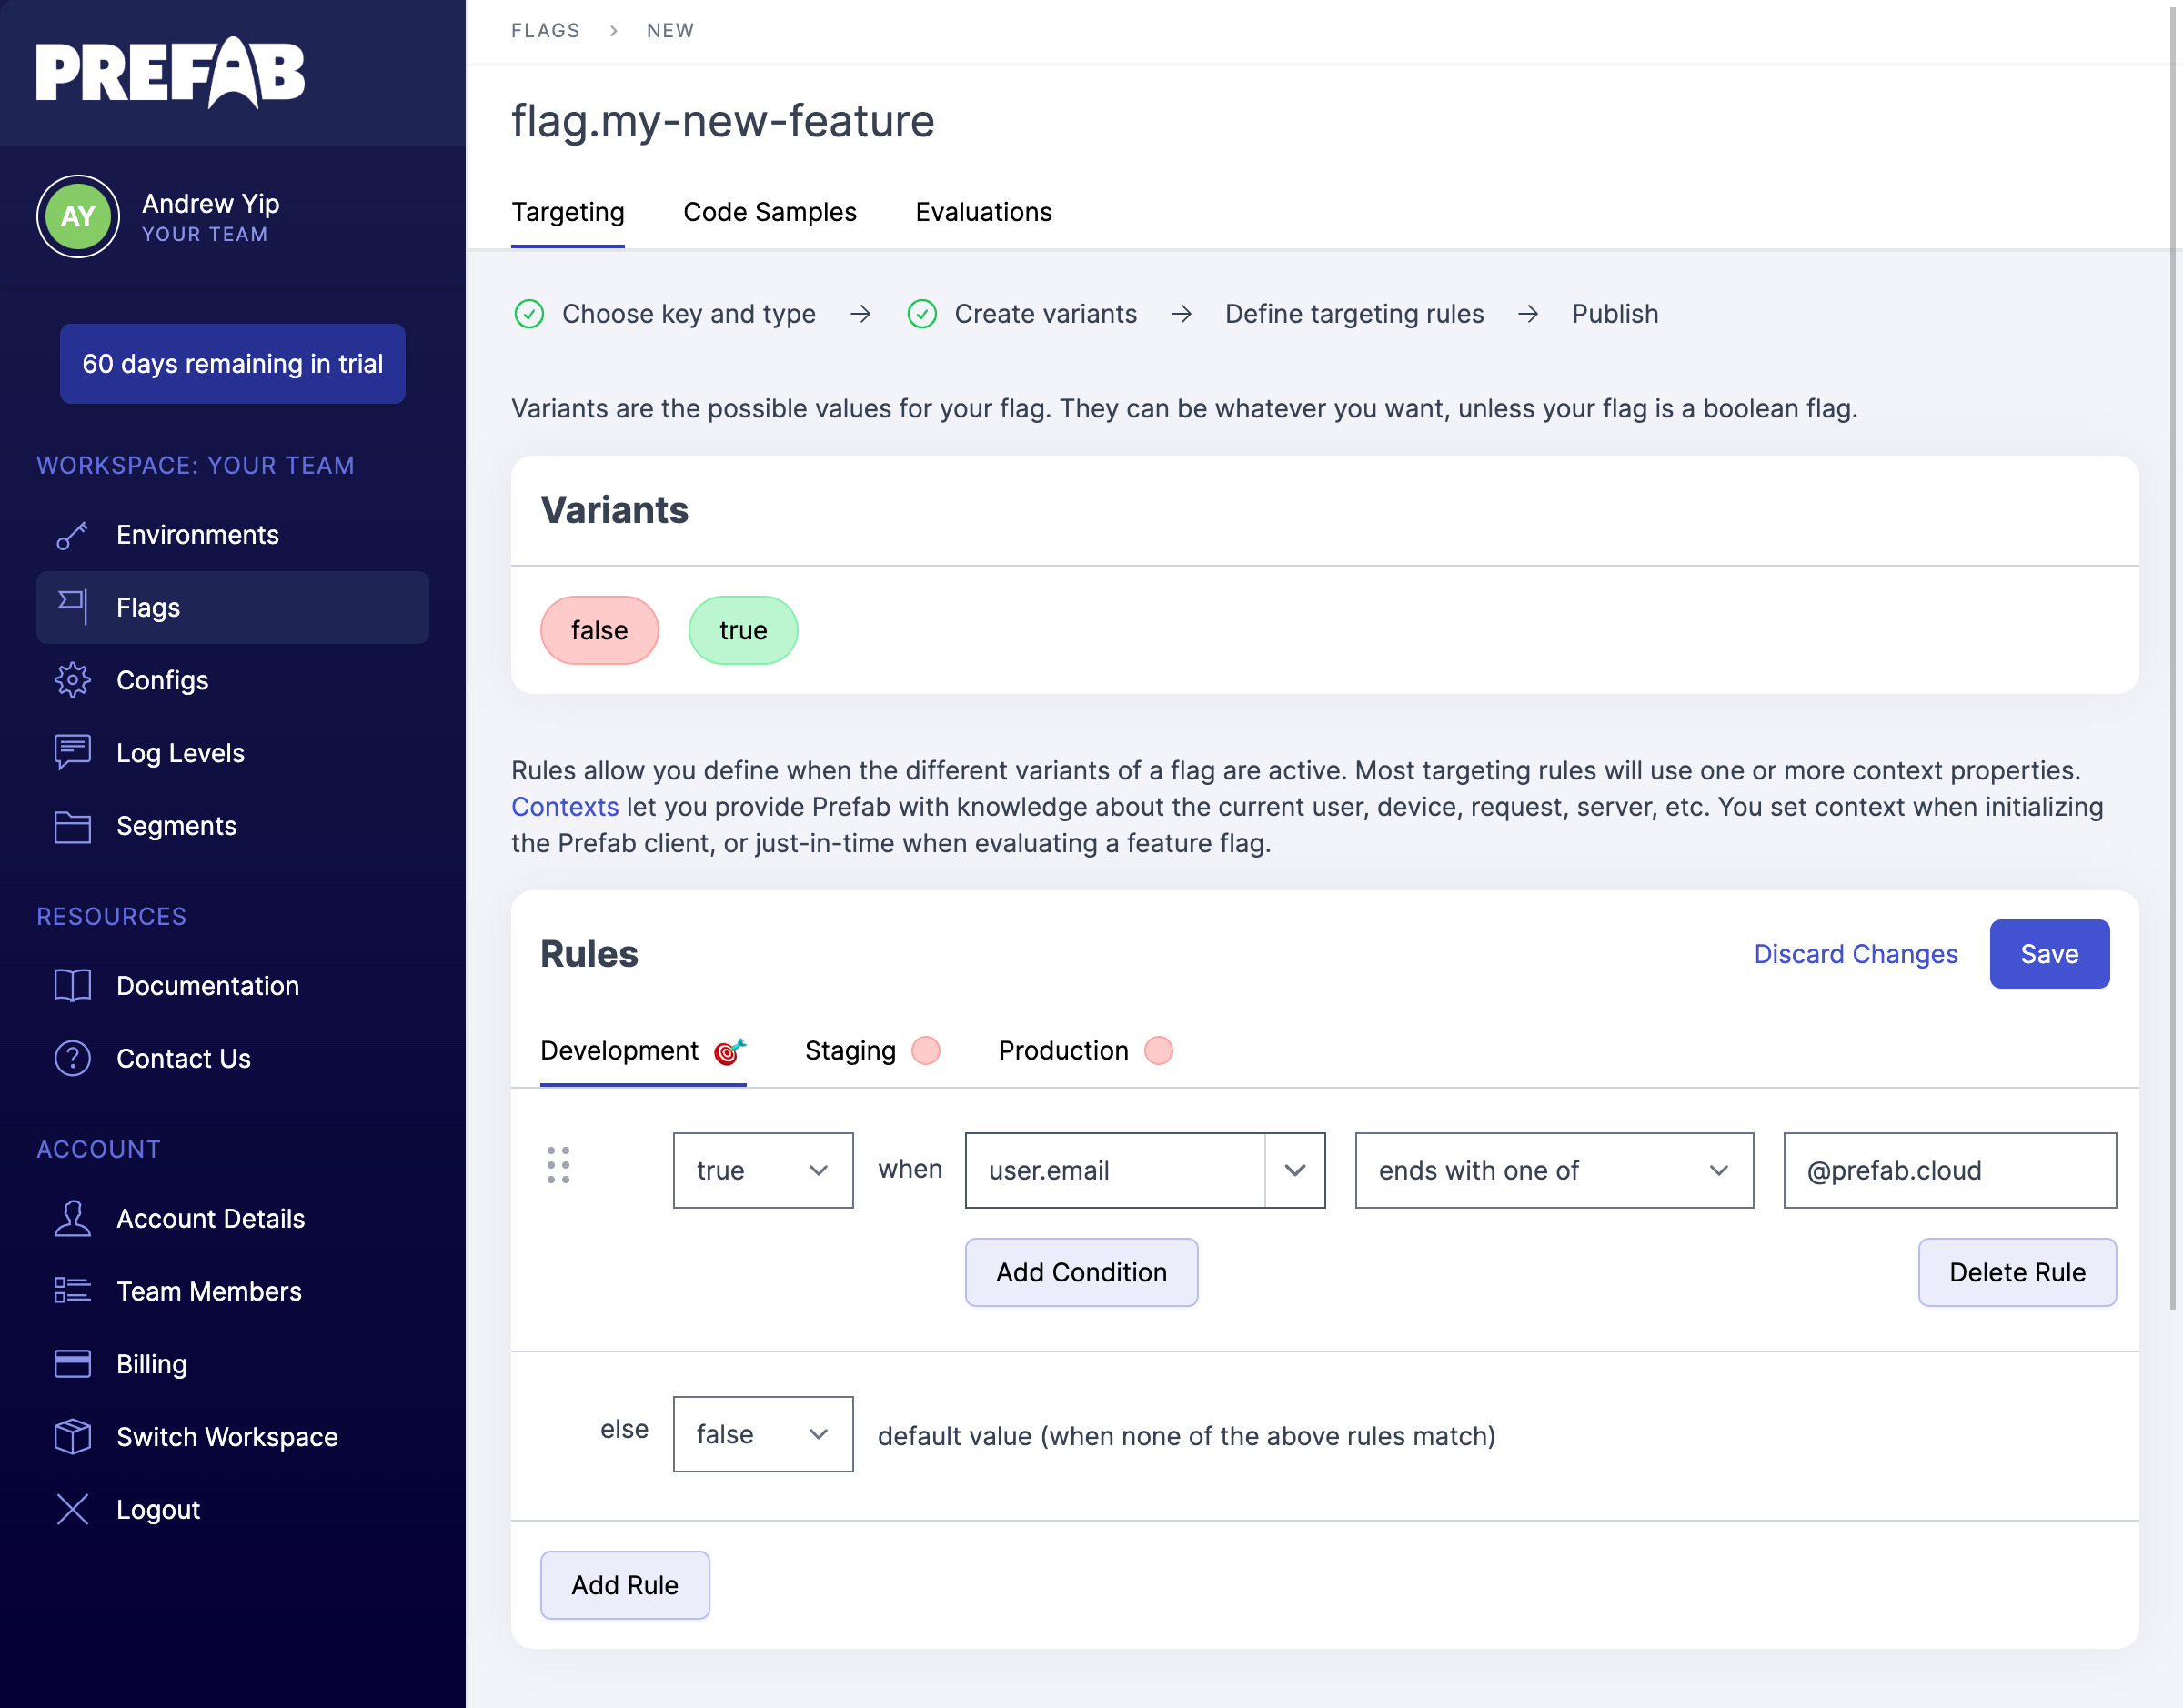
Now let's add a rule under the Development environment:

  1. Click Add Rule
  2. Change the variant of the new rule to true
  3. Enter user.email in the property field
  4. Change the logic operator to ends with one of
  5. Enter @prefab.cloud in the values field
  6. Click Save to save your new rule
info

Prefab creates the Development, Staging, and Production environments automatically, but you can edit, add, or delete environments to meet your needs.

Prefab feature flag rule

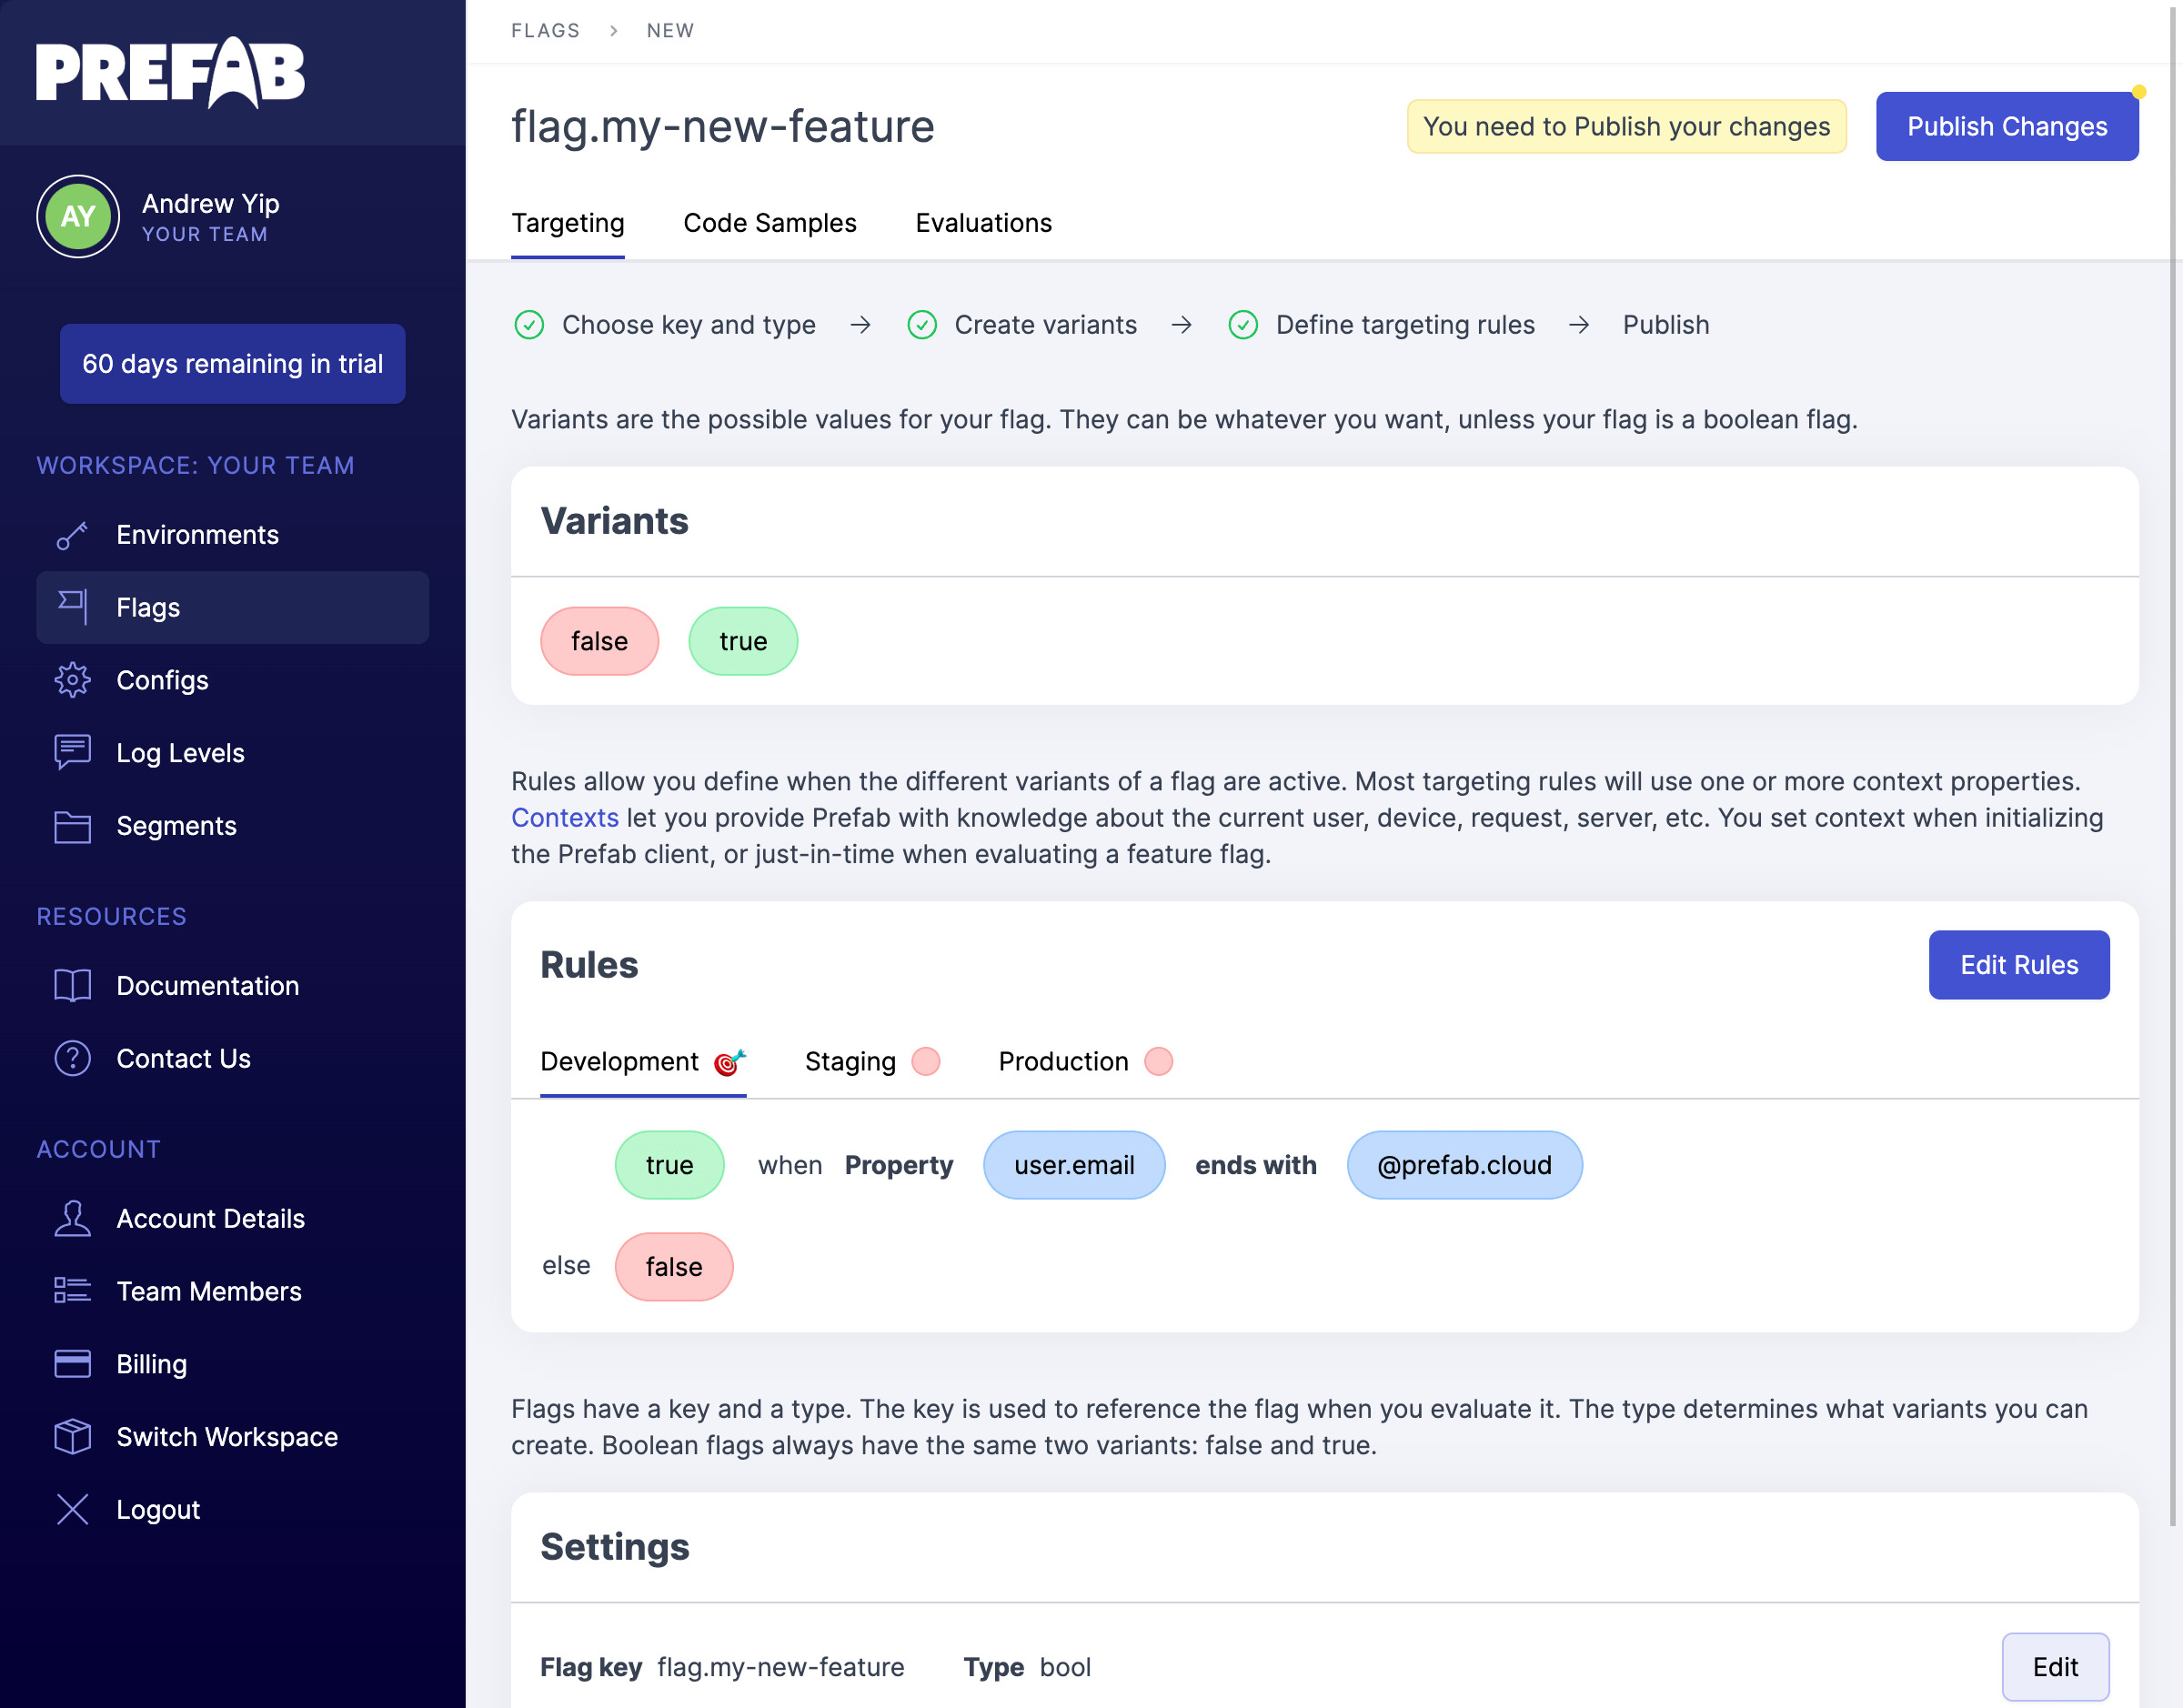
There's one more step. You'll need to click Publish Changes to make your new rule live.

Prefab feature flag publish

That's it! Your new flag is ready to use, but there's one more step before we can write some coe.

Creating an API key

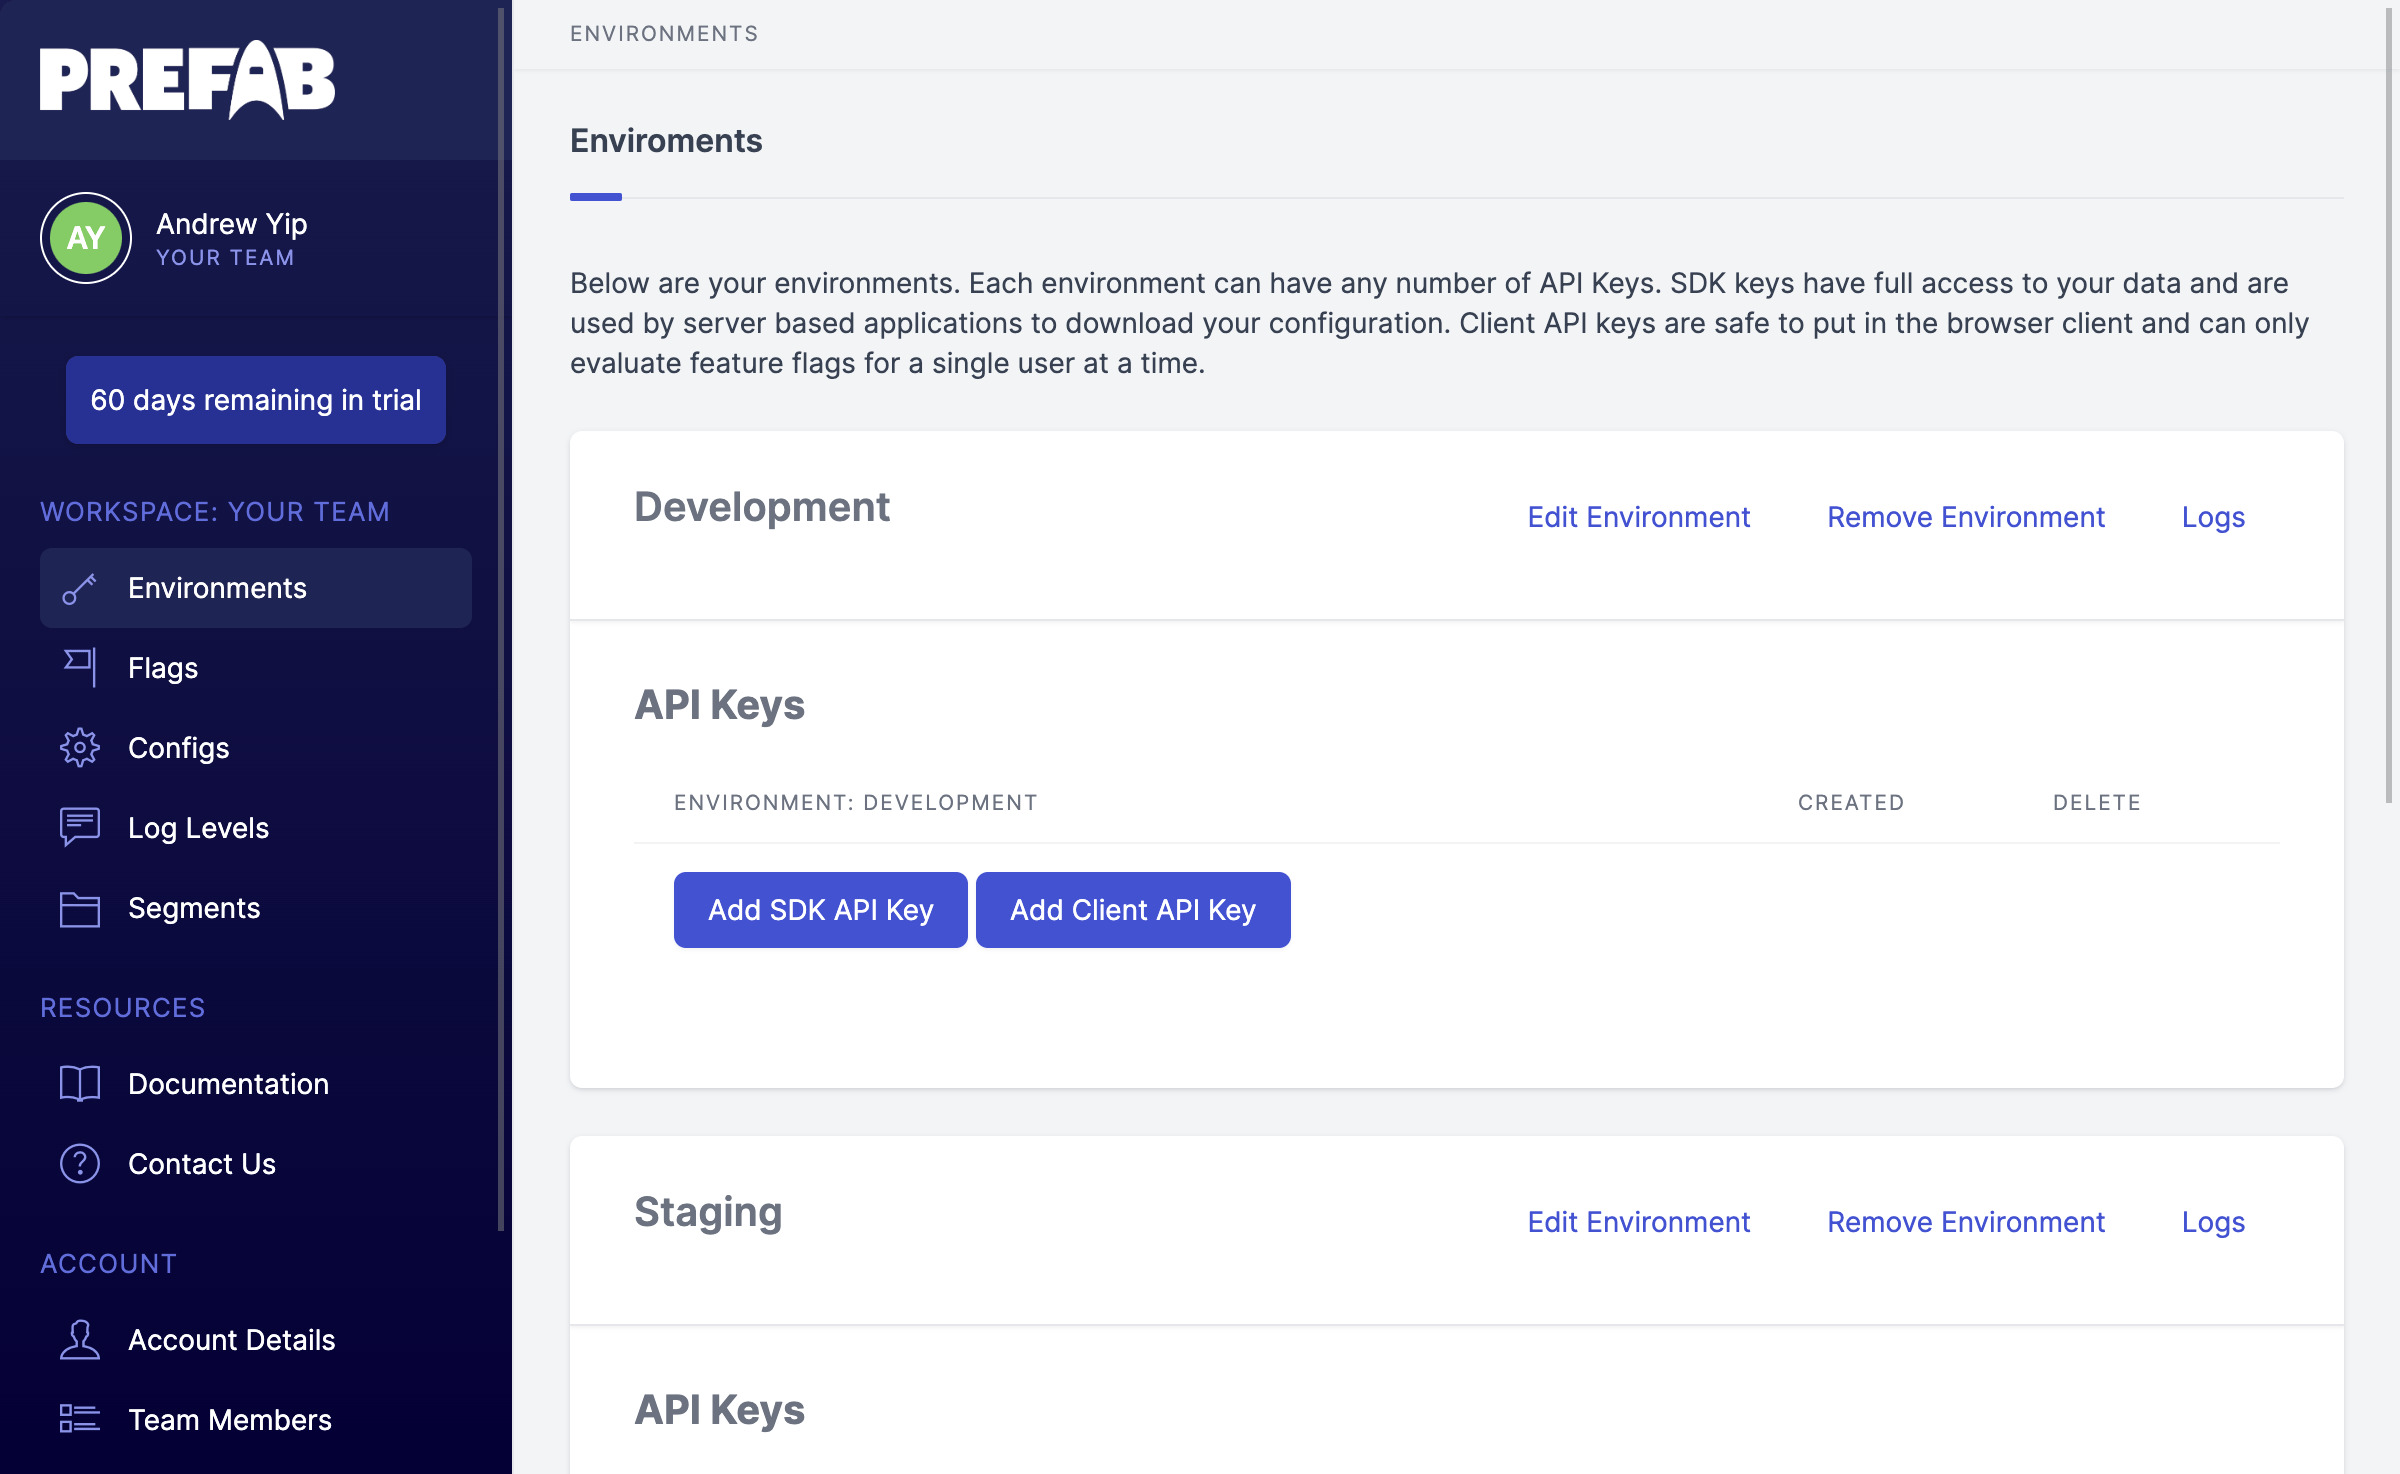
You need to create an API key before you can access Prefab from your code. Click on Environments in the left nav. API Keys belong to environments.

Prefab environments page

Since we're using React, you'll want to create a Client key. You can learn more about client vs. server keys in our docs. Click Add Client API Key under the Development environment and make sure you write down the key. It will only be displayed once.

Setting up Prefab in your React app

Install the latest version

Use your favorite package manager to install @prefab-cloud/prefab-cloud-react npm | github

npm install @prefab-cloud/prefab-cloud-react

Initialize the client

Wrap your component tree in the PrefabProvider, e.g. This will enable you to use our hooks when you want to evaluate a feature flag.

import { PrefabProvider } from "@prefab-cloud/prefab-cloud-react";

const WrappedApp = () => {
const onError = (reason) => {
console.error(reason);
};

return (
<PrefabProvider apiKey={"YOUR_CLIENT_API_KEY"} onError={onError}>
<MyApp />
</PrefabProvider>
);
};

Using hooks to evaluate flags

Now use the usePrefab hook to fetch flags. isEnabled is a convenience method for boolean flags.

const NewFeatureButton = () => {
const { isEnabled } = usePrefab();

if (isEnabled("flag.my-new-feature")) {
return <button>Do the thing!</button>;
}

return null;
};
info

Prefab gives you a single source of truth for feature flags, so your backend and frontend code are always in sync about which variant to assign.

See the result

If we render the NewFeatureButton component, we see nothing. Uh oh, is our flag working? Well if you remember the rules we setup, the default value of the flag is false. It will only be true if the user's email ends with @prefab.cloud, but so far we haven't told Prefab anything about the email address. This is where Context comes in.

Add context to match the Prefab rule

Context is a powerful mechanism that lets you supply metadata about users, teams, devices, or any other entity that's important. You can then use this data for rule targeting. Let's add some context. Usually you'll want to define context once when you setup PrefabProvider.

import { PrefabProvider } from "@prefab-cloud/prefab-cloud-react";

const WrappedApp = () => {
const contextAttributes = {
user: { email: "me@prefab.cloud" },
};

const onError = (reason) => {
console.error(reason);
};

return (
<PrefabProvider
apiKey={"YOUR_CLIENT_API_KEY"}
contextAttributes={contextAttributes}
onError={onError}
>
<App />
</PrefabProvider>
);
};

Now try rendering NewFeatureButton again. You should see our button!

Making a rollout for Production

Let's try one more thing. Suppose you want to gradually release this feature to your users. Prefab supports rollouts that will allocate users in a percentage split (also great for A/B testing!).

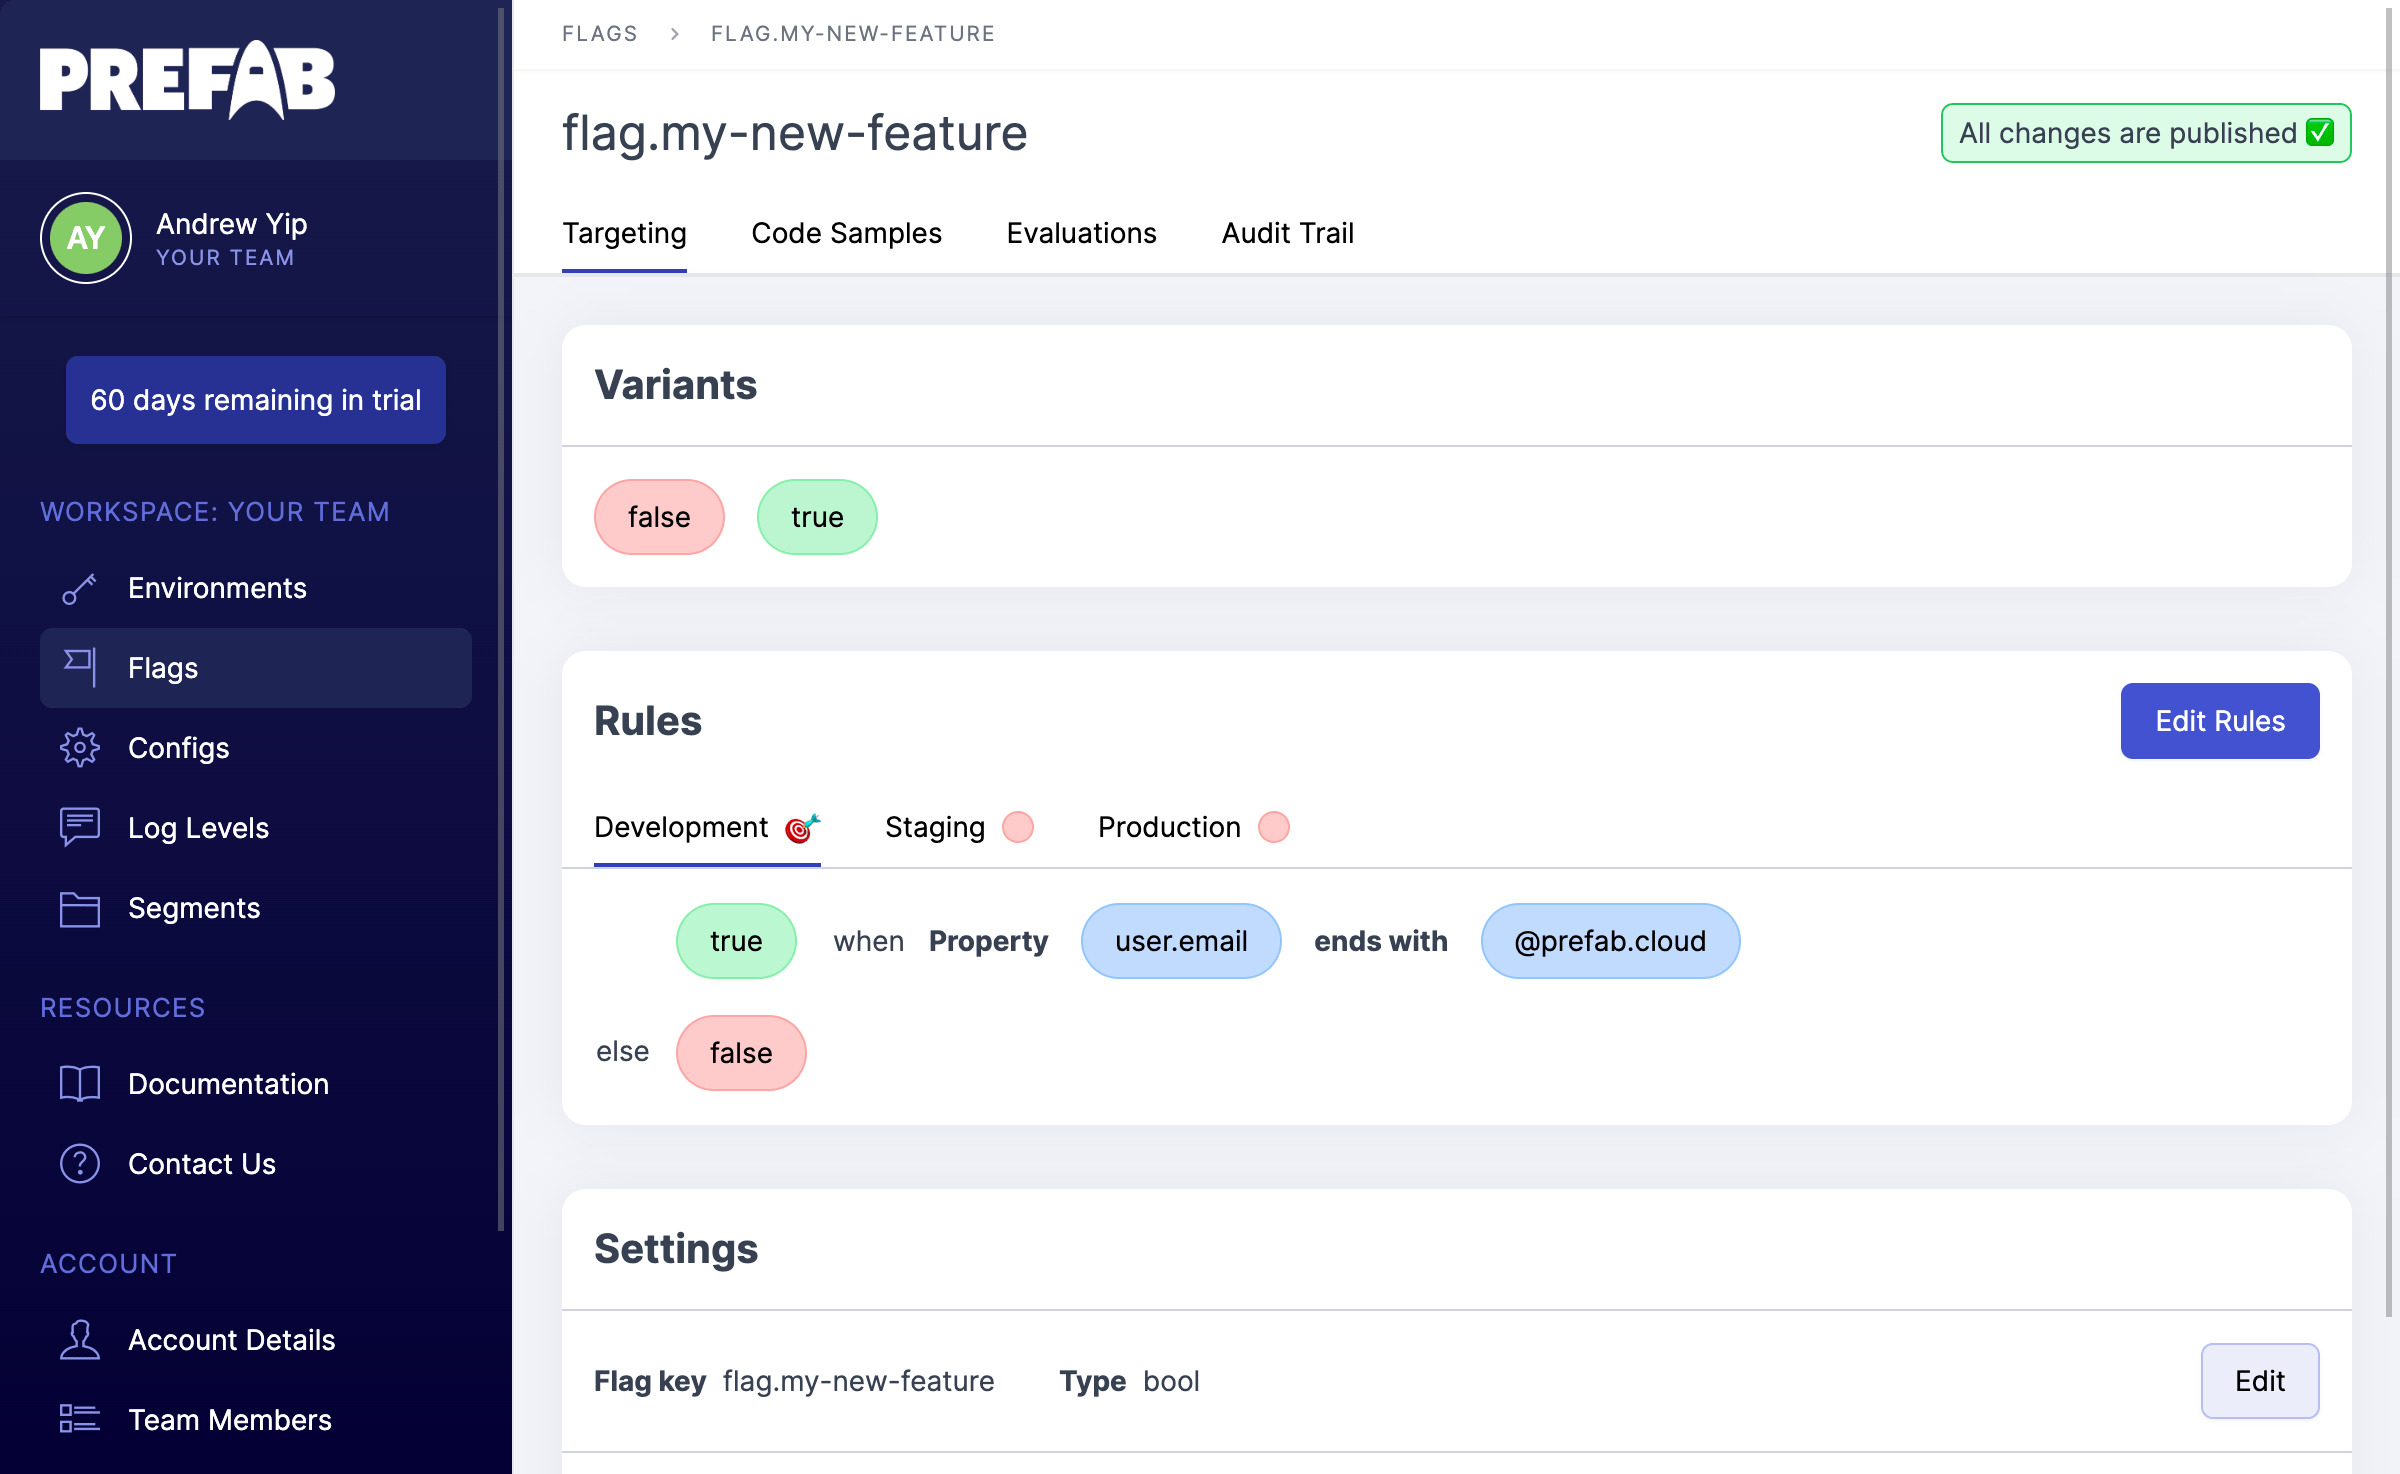
Go back to our feature flag in the Prefab dashboared, and click Edit Rules.

Prefab saved rule

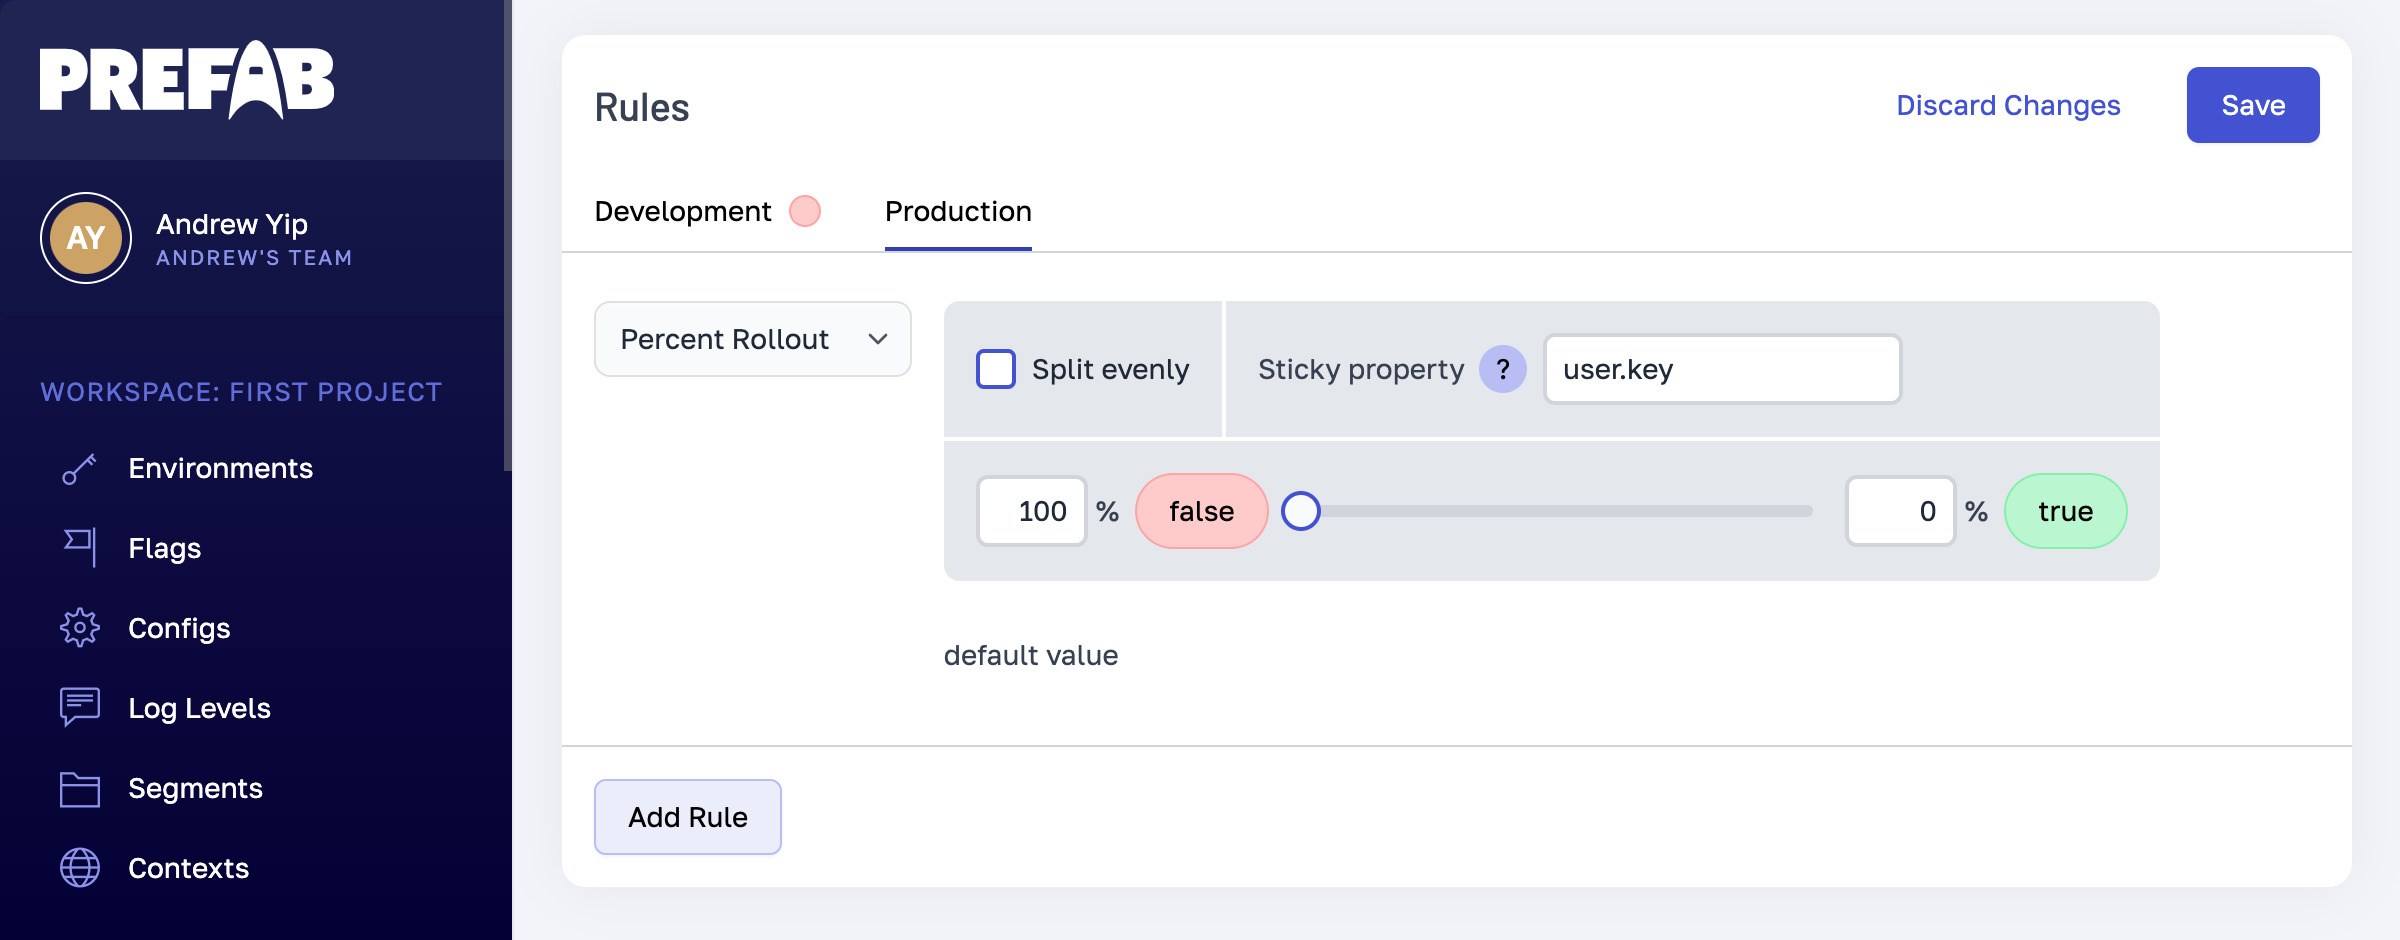
Click on the Production tab, then click on the current variant (false) and change it to Rollout.

Prefab create rollout

Here you can set the percentage of users that should receive each variant. You also need to choose a sticky property, which is a context property that will be used to consistently assign a given user to a variant. In this case we can enter user.email since that will be unique and we're already providing it as context. However, if you have a user tracking ID that is often the best choice.

Testing

What about unit testing? Prefab supplies a PrefabTestProvider component that you can use to force specific variants when setting up tests. You can learn more about testing in our docs.

Time-series Data rollups without in-database date functions

· 4 min read
James Kebinger
James Kebinger
Prefab Founding Engineer
feature flag by cloud host

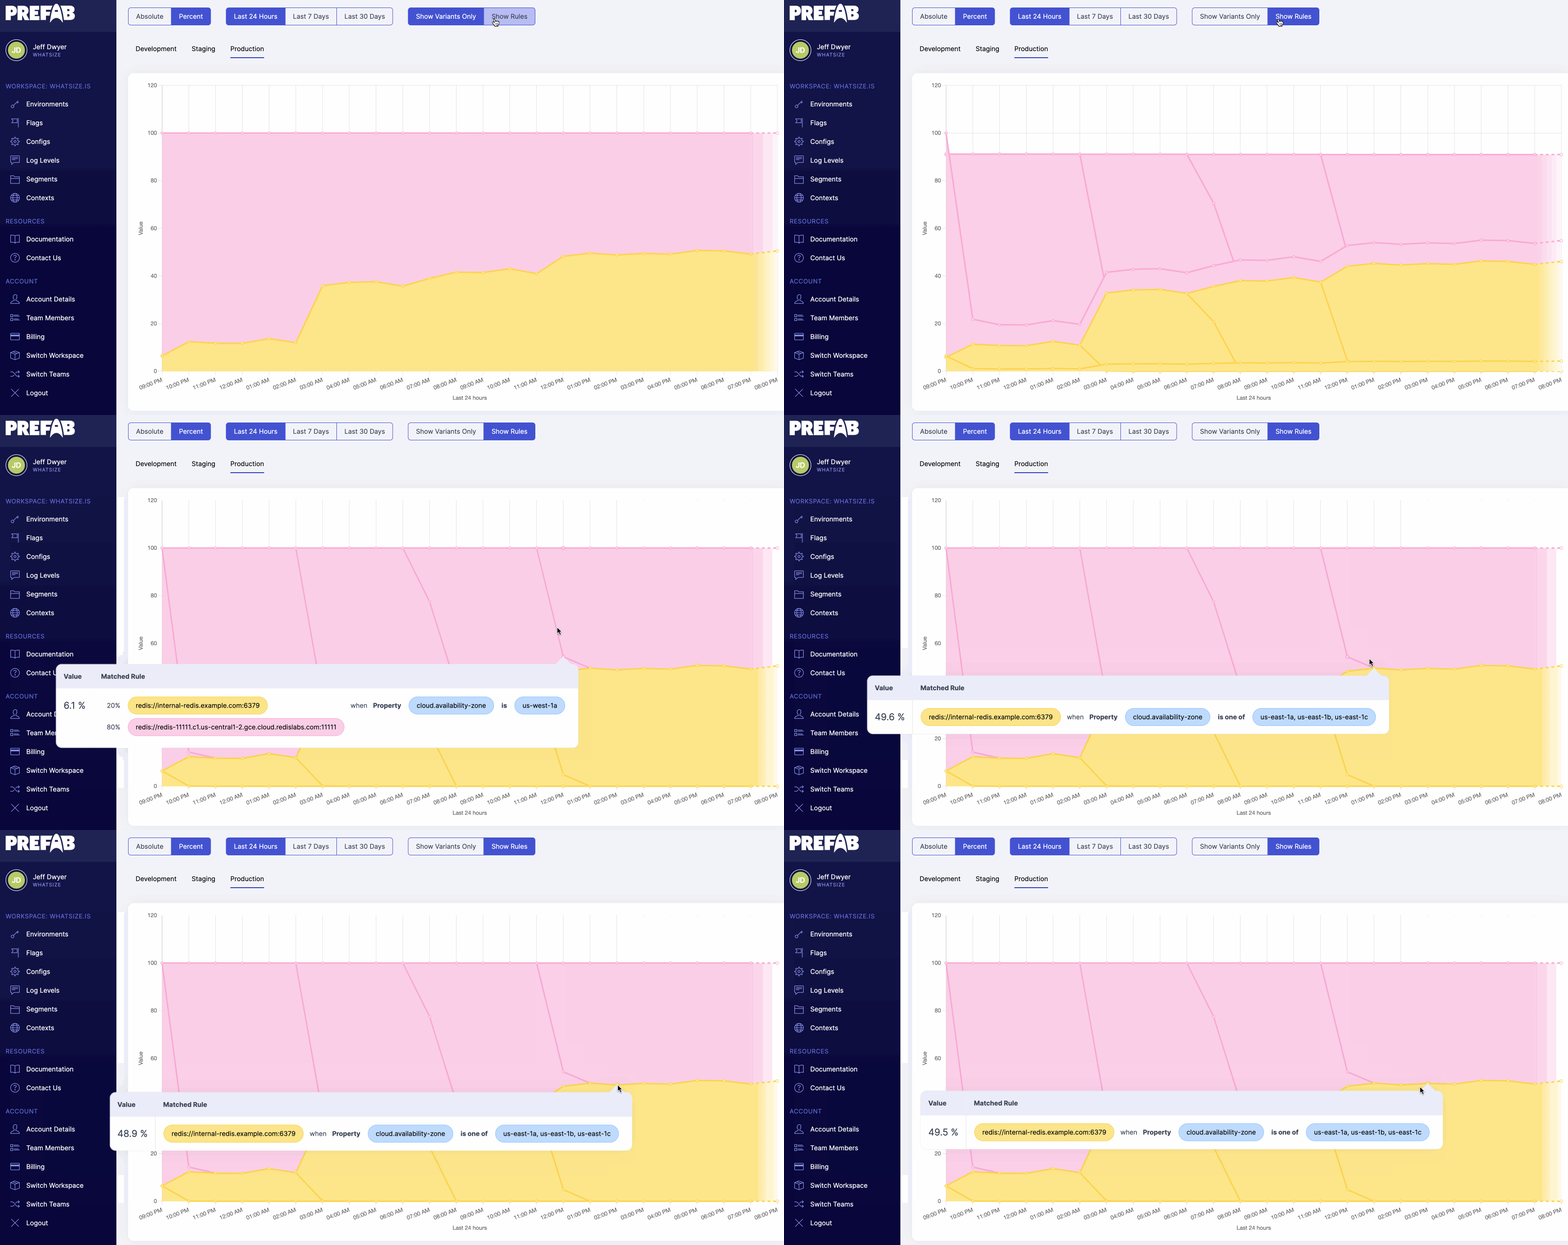
Prefab’s feature flag evaluation charts let you see the distribution of feature flag evaluations over time - nice to see when those configurations have changed or to see automatic rollouts proceed.

How Does It Work (With Date Function)

  1. The clients send telemetry to Prefab HQ containing evaluation counts in short time windows (5-15 seconds), which we store as-is in a (GoogleSQL-dialect) spanner table [^1]. Each row contains start_at and end_at timestamps plus counts and various data about the evaluation.
  2. At query time, we truncate each row’s start_at timestamp to the start of the hour (or day, week) in the user’s timezone using the timestamp_trunc method [^2] and sum the counts, grouping by the truncated timezone like this (simplified) query
SELECT 
timestamp_trunc(start_at, HOUR, ‘America/Chicago),
config_id,

SUM(count)
FROM table_name
GROUP BY 1,2
  1. That gives us all the time intervals that have data - but will completely exclude any time intervals that don’t have any rows in them.
tip

The front-end charting library doesn’t naturally handle sparse data, so to be a nice API, we should fill in the zero intervals. In databases with series-generation functions we can generate all the time intervals and left join the data [^3]. Spanner doesn’t have that so we build the complete set of time intervals in the API code [^4] and then do the equivalent of a LEFT JOIN there.

Again, Without In-Database Date Functions

Faced with the prospect of no date/timestamp truncation method in Postgres-dialect Spanner, I switched this use-case to use GoogleSQL dialect. [^5]. A few days later when I was solving the missing time interval problem (see above) I had a lightbulb moment where I saw how I could do the same truncation without timestamp_truncand friends, and potentially more flexibly.

Starting with the assumption that all the rows containing data have a start_at column in UTC milliseconds:

  1. Use a date library in your application to convert the user’s selected start time into a UTC timestamp (call this chart_start_at)

  2. Calculate milliseconds in each selected time period (eg 1 hour = 3,600,000 mills) - this is our interval_ms.

  3. Subtract chart_start_at from every start_at and then use integer division to calculate integral multiples of offset from the start time. start_at - chart_start_at / interval_ms

  4. Group and sum the data by those integral offsets. In GoogleSQL-dialect Spanner that’ll look like this (where 1692907200000 is the chart_start_at and 3600000 is an hour

    SELECT 
    SELECT DIV((start_at-1692907200000),3600000) as start_at_interval_muliples,
    config_id,

    SUM(count)
    FROM table_name
    WHERE start_at >= 1692907200000 ...
    GROUP BY 1,2
  5. This will generate a series of rows with multiples of the offsets since the start time. You’ll need to reconstitute those to real timestamps at some point, either in SQL or your application. To do that just multiply by the offset and add the start time again (start_at - chart_start_at / interval_ms) * interval_ms + chart_start_at

One nice thing about this approach is its easy to customize the interval time beyond what may be possible using an in-database function - want to rollup in database to 4 hour intervals? Go for it!

Notes:

[^1] One day it’ll make sense to periodically pre-roll up this data to eg 15 minute intervals but we done that yet. Note 15 minutes is the largest practical pre-rolled up data interval because there are timezones with hour+-15 minute offsets from UTC

[^2] Timestamp_trunc spanner docs

[^3] I used and wrote about this approach a couple of jobs ago

[^4] Our time span generator

[^5] Not the only reason! See Friends Don’t Let Friends Use PostgreSQL Dialect Google Spanner

TL;DR: Origin Response Headers In Fastly Logs

· 2 min read
James Kebinger
James Kebinger
Prefab Founding Engineer
Getting Headers in the Right Place

CDNs are great, but they can be a bit of a black box. What if you want to see your CDN traffic broken down by customer? The CDN has that information, but how can we get it out?

Fastly’s CDN hosts our customer’s configuration data so that it is available even if Prefab’s API were to be unavailable. In order to understand our CDN traffic broken down by customer, we set out to use Fastly’s logging product to stream data back to us containing information from our API response but hit a bump in understanding the varnish/Fastly object model.

First Problem: Customer Identification

The default Fastly Log format doesn’t contain a lot of data. To make downstream computation more straightforward, we set out to add a couple of headers to our API’s configuration responses that would identify the API key used to request the configuration. Those are the prefab-key-id and prefab-env-id.

Second Problem: Getting New Headers Back In Fastly Logs

First, I thought it would be as easy as adding something like “prefab_env_key_id”: %{beresp.http.Prefab-EnvId}V" to the JSON log format to get the new headers shipped our way, but I was confronted with an error message indicating the vcl_log method didn’t have access to that variable. I asked a question in the Fastly Developers community and got a helpful answer.

Varnish All The Way Down

Fastly is a great user experience wrapped around the Varnish HTTP Cache, which shows in its references to VCL (Varnish Control Language) snippets and callbacks like vcl_fetch, vcl_deliver, and vcl_log. Each of those callbacks (subroutines) has access to different objects, so the trick is to use those subroutines to copy data from the original (origin) response (known as beresp) in varnish to the cache object resp so that future invocations of vcl_log have access to that.

In Fastly Configuration, Content → Headers let us do this without writing any VCL.

Fastly UI

Now that the header Prefab-EnvId is set on the cached object, we can refer to that using resp.http.Prefab-EnvId in the JSON logging format like this

"pf_env_id": "%{json.escape(resp.http.Prefab-EnvId)}V"

TL;DR: Targeting Datadog Slack Alerts to Different Channels By Environment

· 2 min read
James Kebinger
James Kebinger
Prefab Founding Engineer
Dogs in the right boxes

After we spent months with all of our Datadog alerts for both staging and production routed to a single slack #alerts channel, we all got tired of looking in that room with urgency to see something happening in staging again. The team asked me to figure out how to create environment-specific alert channels, so here’s what I did.

The Documentation

The slack integration document includes a mention of using message template variables interpolation to dynamically create @-mentions

Best practices for tagging your infrastructure and applications is a long read on the virtues of adding tags (like team ownership) to infrastructure so those tags can be used in alerts.

TL;DR

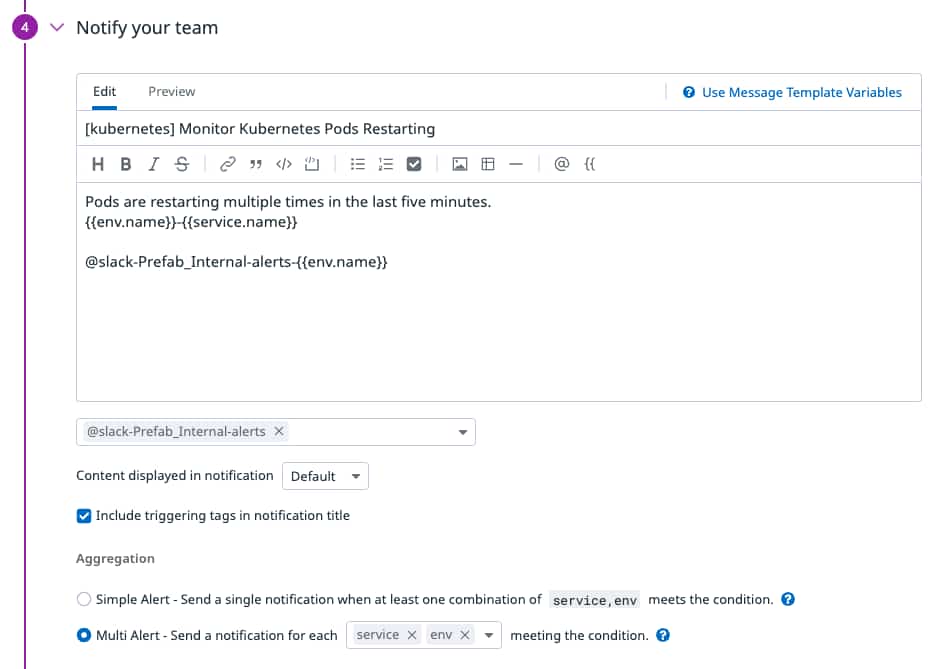
Once you’ve set up a monitor with a Slack alert, you’ll see something like this in the message: @slack-Prefab_Internal-alerts. That’s a hyphen delimited integration name, integration install name, and then the channel.

To target specific environments by the env tag that’s usually available, edit the monitor’s message like this @slack-Prefab_Internal-alerts-{{env.name}}. The drop-down box below the message won’t be helpful, but this works.

Then setup a slack channel like #alerts-production.

datadog UI for notifications

You may also want to specify the “Multi Alert” aggregation options we chose.

Hands-On LSP Tutorial: Configuration

· 7 min read
Jeffrey Chupp
Jeffrey Chupp
Prefab Founding Engineer. Three-time dad. Polyglot. I am a pleaser. He/him.

In Hands-On LSP Tutorial: Building a Custom Auto-Complete, we built a language server to provide our text editors with GitHub Issue and PR completion.

Final code from that post
import fetch from "node-fetch";
import {
createConnection,
InitializeResult,
TextDocumentSyncKind,
TextDocuments,
} from "vscode-languageserver/node";
import { TextDocument } from "vscode-languageserver-textdocument";

const connection = createConnection();

const documents: TextDocuments<TextDocument> = new TextDocuments(TextDocument);

type Edge = {
node: {
title: string;
number: number;
url: string;
body: string;
};
};

type Response = {
data: { search: { edges: Edge[] } };
};

// Replace with your real GitHub access token
const accessToken = "YOUR_GITHUB_ACCESS_TOKEN";

const searchScope = "repo:facebook/docusaurus";

const search = async (input: string): Promise<Response> => {
const query = `
{
search(query: "${searchScope} ${input}", type: ISSUE, first: 10) {
edges {
node {
... on PullRequest {
title
number
body
url
}
... on Issue {
title
number
body
url
}
}
}
}
}
`;

const response = await fetch("https://api.github.com/graphql", {
method: "POST",
body: JSON.stringify({ query }),
headers: {
Authorization: `Bearer ${accessToken}`,
},
});

if (!response.ok) {
const error = {
status: response.status,
statusText: response.statusText,
body: await response.json(),
};

connection.console.error(
`Error fetching from GitHub: ${JSON.stringify(error)}`,
);
}

return await response.json();
};

connection.onInitialize(() => {
const result: InitializeResult = {
capabilities: {
textDocumentSync: TextDocumentSyncKind.Incremental,
// Tell the client that the server supports code completion
completionProvider: {
// We want to listen for the "#" character to trigger our completions
triggerCharacters: ["#"],
},
},
};

return result;
});

connection.onCompletion(async (params) => {
const doc = documents.get(params.textDocument.uri);

if (!doc) {
return null;
}

const line = doc.getText().split("\n")[params.position.line];

// return early if we don't see our trigger character
if (!line.includes("#")) {
return null;
}

const input = line.slice(line.lastIndexOf("#") + 1);

const json = await search(input);

const items = json.data.search.edges.map((edge) => {
return {
label: `#${edge.node.number}: ${edge.node.title}`,
detail: `${edge.node.title}\n\n${edge.node.body}`,
textEdit: {
range: {
start: {
line: params.position.line,
character: line.lastIndexOf("#"),
},
end: {
line: params.position.line,
character: params.position.character,
},
},
newText: `${edge.node.url}`,
},
};
});

return {
isIncomplete: true,
items,
};
});

// Make the text document manager listen on the connection
// for open, change and close text document events
documents.listen(connection);

// Listen on the connection
connection.listen();

It works, but searchScope (e.g., repo:facebook/docusaurus) and our GitHub access token are hard-coded. That's fine for local development, but to get this language server ready to share, we should make those configurable.

Approach

  1. We'll update server.ts to use editor-provided config instead of hard-coded values.
  2. We'll update our editor setup to provide config to the server.

Updating our server to use config

First, we remove previous assignments of accessToken and searchScope.

- // Replace with your real GitHub access token
- const accessToken = "YOUR_GITHUB_ACCESS_TOKEN";
-
- const searchScope = "repo:facebook/docusaurus";

Instead, we specify the shape of our configuration, a default number of max results, and default our config to an empty object.

interface Config {
githubAccessToken?: string;
searchScope?: string;
maxResults?: number;
}

const DEFAULT_MAX_RESULTS = 10;

let config: Config = {};

Next, we change our search query to the searchScope and maxResults from our settings.

- const search = async (input: string): Promise<Response> => {
- const query = `
- {
- search(query: "${searchScope} ${input}", type: ISSUE, first: 10) {
const search = async (input: string): Promise<Response> => {
const query = `
{
search(query: "${config.searchScope} ${input}", type: ISSUE, first: ${
config.maxResults ?? DEFAULT_MAX_RESULTS
}) {

We use the token from our config.

- Authorization: `Bearer ${accessToken}`,
Authorization: `Bearer ${config.githubAccessToken}`,

We'll add a getConfig function to get the current config from the editor. We look up our configuration by a prefix we specify (here, myLSP).

const getConfig = async () => {
config = await connection.workspace.getConfiguration("myLSP");
};

Finally, we call getConfig in our onCompletion function and we return early with an error if we're missing any required fields.

connection.onCompletion(async (params) => {
await getConfig();

if (!config.githubAccessToken || !config.searchScope) {
connection.console.error("Both githubAccessToken and searchScope required");
return;
}
// ...

That's all we needed to change for our server.

Updated full server.ts code
import fetch from "node-fetch";
import {
createConnection,
InitializeResult,
TextDocumentSyncKind,
TextDocuments,
} from "vscode-languageserver/node";
import { TextDocument } from "vscode-languageserver-textdocument";

const connection = createConnection();

const documents: TextDocuments<TextDocument> = new TextDocuments(TextDocument);

type Edge = {
node: {
title: string;
number: number;
url: string;
body: string;
};
};

type Response = {
data: { search: { edges: Edge[] } };
};

interface Config {
githubAccessToken?: string;
searchScope?: string;
maxResults?: number;
}

const DEFAULT_MAX_RESULTS = 10;

let config: Config = {};

const search = async (input: string): Promise<Response> => {
const query = `
{
search(query: "${config.searchScope} ${input}", type: ISSUE, first: ${
config.maxResults ?? DEFAULT_MAX_RESULTS
}) {
edges {
node {
... on PullRequest {
title
number
body
url
}
... on Issue {
title
number
body
url
}
}
}
}
}
`;

const response = await fetch("https://api.github.com/graphql", {
method: "POST",
body: JSON.stringify({ query }),
headers: {
Authorization: `Bearer ${config.githubAccessToken}`,
},
});

if (!response.ok) {
const error = {
status: response.status,
statusText: response.statusText,
body: await response.json(),
};

connection.console.error(
`Error fetching from GitHub: ${JSON.stringify(error)}`,
);
}

return await response.json();
};

const getConfig = async () => {
config = await connection.workspace.getConfiguration("myLSP");
};

connection.onInitialize(() => {
const result: InitializeResult = {
capabilities: {
textDocumentSync: TextDocumentSyncKind.Incremental,
// Tell the client that the server supports code completion
completionProvider: {
// We want to listen for the "#" character to trigger our completions
triggerCharacters: ["#"],
},
},
};

return result;
});

connection.onCompletion(async (params) => {
await getConfig();

if (!config.githubAccessToken || !config.searchScope) {
connection.console.error("Both githubAccessToken and searchScope required");
return;
}

const doc = documents.get(params.textDocument.uri);

if (!doc) {
return null;
}

const line = doc.getText().split("\n")[params.position.line];

// return early if we don't see our trigger character
if (!line.includes("#")) {
return null;
}

const input = line.slice(line.lastIndexOf("#") + 1);

const json = await search(input);

const items = json.data.search.edges.map((edge) => {
return {
label: `#${edge.node.number}: ${edge.node.title}`,
detail: `${edge.node.title}\n\n${edge.node.body}`,
textEdit: {
range: {
start: {
line: params.position.line,
character: line.lastIndexOf("#"),
},
end: {
line: params.position.line,
character: params.position.character,
},
},
newText: `${edge.node.url}`,
},
};
});

return {
isIncomplete: true,
items,
};
});

// Make the text document manager listen on the connection
// for open, change and close text document events
documents.listen(connection);

// Listen on the connection
connection.listen();

Providing config from the editor

As in the previous post, I will cover VS Code and Neovim here.

How to configure your server with VS Code

VS Code extensions specify configuration via the root package.json. Replace your contributes block with the following:

"contributes": {
"configuration": {
"title": "My Extension Name",
"properties": {
"myLSP.githubAccessToken": {
"type": "string",
"default": "",
"description": "Your GitHub access token"
},
"myLSP.searchScope": {
"type": "string",
"default": "repo:facebook/docusaurus",
"description": "Search scope for GitHub PRs/Issues"
},
"myLSP.maxResults": {
"type": "number",
"default": 10,
"description": "Max number of completion suggestions"
}
}
}
},

Note that the myLSP prefix on the properties matches the string we use in our getConfig function.

Once you've repackaged and reinstalled your extension, you can modify the settings by pressing ctrl+shift+p (cmd+shift+p on Mac) and typing "Open Settings UI"

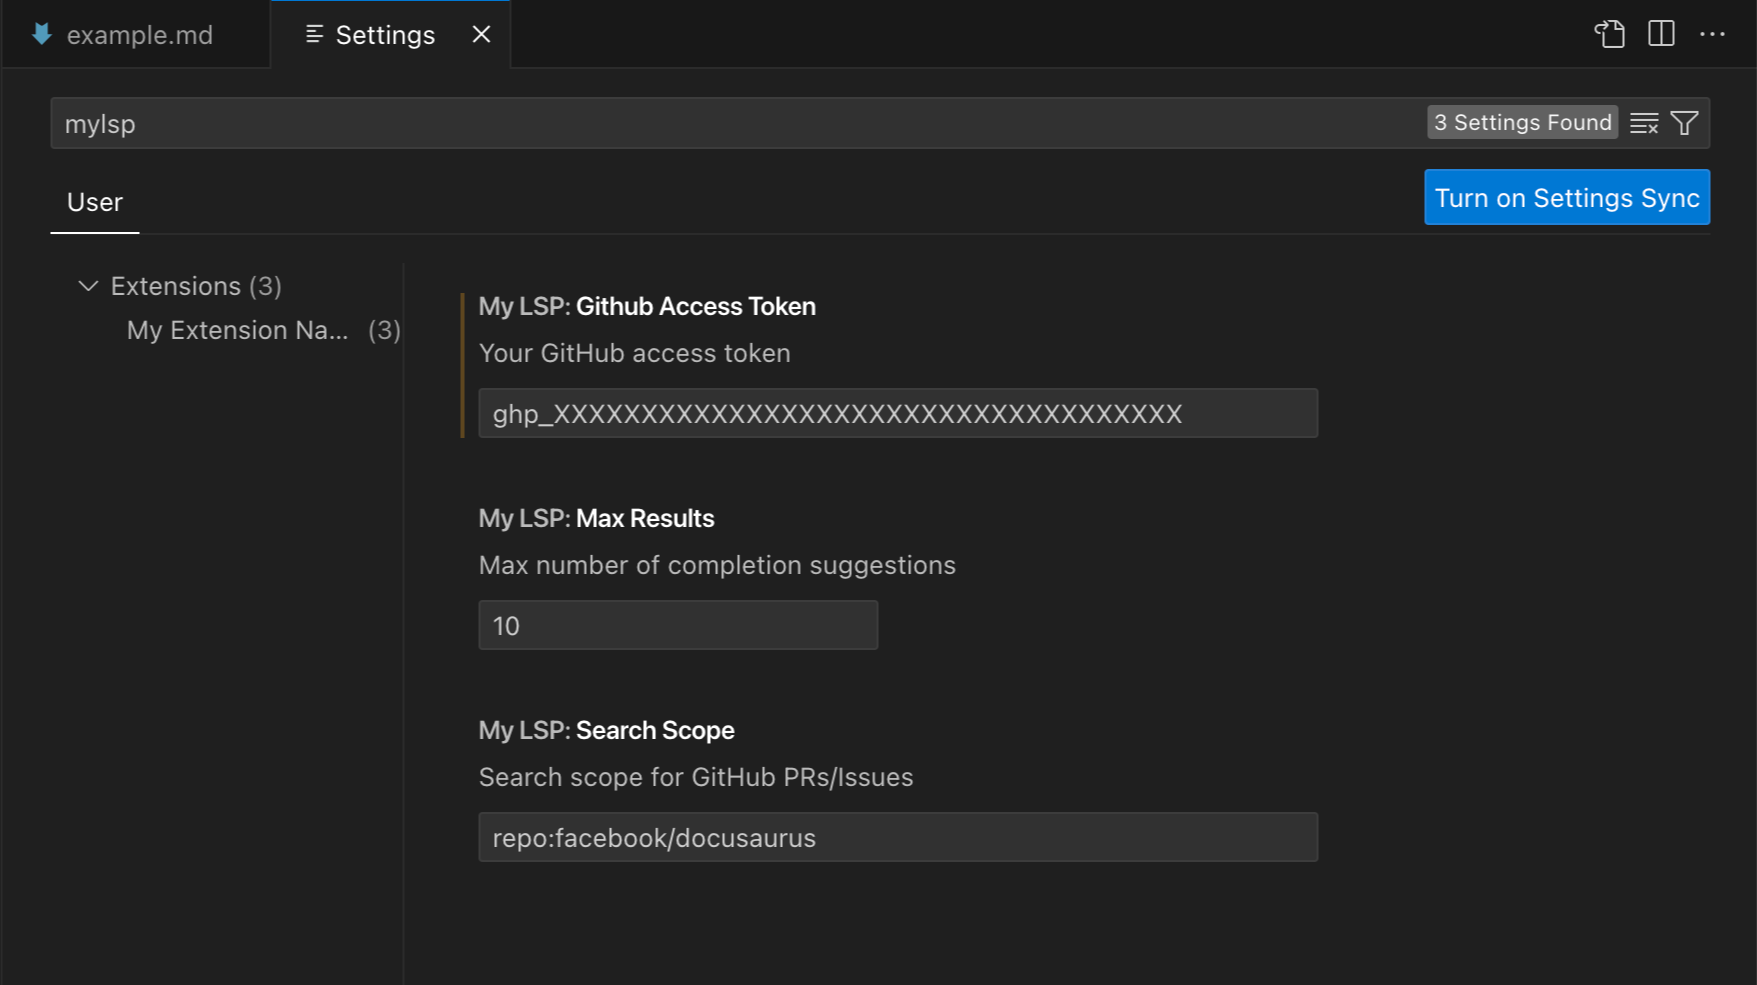
Once in the Settings UI, search for myLSP to modify your settings.

vs-code example

Changes take effect immediately because we pull the settings in our server as needed.

How to configure your server with Neovim

For Neovim, we modify our vim.lsp.start invocation to add a settings table to our configuration.

vim.lsp.start {
name = "test-ls",
--- ...
settings = {
myLSP = {
githubAccessToken = os.getenv("GITHUB_ACCESS_TOKEN"),
searchScope = "owner:github",
maxResults = 15,
}
},
}

Since we only provide these settings in our vim.lsp.start, you'll need to restart your editor for changes to take effect.

What's next?

Next, we will look at distributing our language server to make it trivial for our coworkers and friends to install and use in their editors.

If you'd like to be notified when I publish more LSP content, sign up for my newsletter.

Hands-On LSP Tutorial: Building a Custom Auto-Complete

· 10 min read
Jeffrey Chupp
Jeffrey Chupp
Prefab Founding Engineer. Three-time dad. Polyglot. I am a pleaser. He/him.

What we'll build in this tutorial

Today, we'll build out completion for linking to GitHub issues and PRs.

Developers can use this completion to reference issues and PRs from their code comments and commit messages.

What is a Language Server?

Language servers let you meet developers where they are: their editor. They give you the power of in-editor tooling without rebuilding your tools for each editor you want to support. They can implement features like completion, go-to-definition, code actions, and more.

The Language Server Protocol (LSP) specifies how a language server should interface with an editor.

Approach

  1. We'll build a language server prototype with hard-coded completion choices.
  2. We'll wire this to our editor and test it out.
  3. We'll replace the hard-coded choices with dynamic content from GitHub's API.

Prototyping our Language Server

We'll build this demo in Typescript.

We install a few dependencies to handle the language server implementation details. We'll also install node-fetch to help us make API requests.

npm install vscode-languageserver vscode-languageserver-textdocument vscode-languageclient node-fetch@2
npm install --save-dev @types/vscode @types/node-fetch

(Don't let the vscode bits confuse you. While Microsoft publishes these packages, your language server will be editor-agnostic.)

Now, we can start writing our code. We'll start with distilled boilerplate code borrowed from the Visual Studio Code Language Server Extension Guide.

import {
createConnection,
InitializeResult,
TextDocumentSyncKind,
TextDocuments,
} from "vscode-languageserver/node";
import { TextDocument } from "vscode-languageserver-textdocument";

const connection = createConnection();

const documents: TextDocuments<TextDocument> = new TextDocuments(TextDocument);

connection.onInitialize(() => {
const result: InitializeResult = {
capabilities: {
textDocumentSync: TextDocumentSyncKind.Incremental,
// Tell the client that the server supports code completion
completionProvider: {
// We want to listen for the "#" character to trigger our completions
triggerCharacters: ["#"],
},
},
};

return result;
});

// Make the text document manager listen on the connection
// for open, change and close text document events
documents.listen(connection);

// Listen on the connection
connection.listen();

After our imports, we set up a connection and some documents. The connection handles the communication between the editor (the client) and our code (the server). documents is a store of open files in our editor. documents stays in sync when files open, close, and change.

When the editor starts our server, onInitialize is fired. The editor sends some params describing what it can do (and what it wants our server to do), but we're not using those here, so we'll omit them. We reply with a list of things we can do (primarily, we offer completions triggered by #).

We tell documents to listen on the connection and the connection to listen for communication from the editor.

Our server could now run hosted by the editor (more on that later), but it doesn't do anything useful yet.

Let's add the initial hard-coded completion after our onInitialize.

connection.onCompletion(() => {
return [
{
label: "Cannot set properties of undefined (setting 'minItems')",
data: "https://github.com/facebook/docusaurus/issues/9271",
},
{
label: "docs: fix typo in docs-introduction",
data: "https://github.com/facebook/docusaurus/pull/9267",
},
{
label: "Upgrade notification command does not copy properly",
data: "https://github.com/facebook/docusaurus/issues/9239",
},
];
});

Now, we're ready to test this out.

Wiring this up to our Editor/IDE

While the LSP standardizes how to implement Language Servers and how they talk to editors, there's no good standard for making your editor aware of a language server so that it is ready to be used. For this post, I'll cover VS Code and Neovim.

How to connect your Language Server to VS Code

You connect a language server to VS Code by creating a thin extension layer. To make things as easy as possible for you, I've published a Minimum Viable VS Code Language Server Extension. Follow the directions in that repo and replace the entire contents of server/src/server.ts with the code we're writing in this post.

After following those directions, we'll also need to install node-fetch for the server since the node version packaged with VS Code is too old to include native fetch support.

cd server && npm install node-fetch@2 && npm install --save-dev @types/node-fetch && cd -

Now, you should be able to test your extension with the steps mentioned here. You should be able to open a new file, type #, and then see something like this:

vs-code example

How to connect your Language Server to Neovim

For Neovim, you pass some configuration to vim.lsp.start. For testing, I've put the following in ~/.config/nvim/after/ftplugin/ruby.lua. Note that this location means it only runs in ruby files. Feel free to start the server elsewhere.

local capabilities = vim.lsp.protocol.make_client_capabilities()

vim.lsp.start {
name = "test-ls",
cmd = {
"npx", "ts-node",
"/Users/ship/src/lsp-example-completion/server.ts",
"--stdio"
},
capabilities = capabilities
}

I'm using npx ts-node to run my server.ts without an intermediate build step, but you can use whatever approach you prefer.

You should be able to open a new file, type #, and then see something like this:

neovim example

If you encounter any trouble, check the output of :LspLog

Dynamic Completions

GitHub provides a GraphQL API. Get a GitHub access token and have it handy. It appears a classic token with "repo" permissions is required to get the search query to work correctly (at the time of writing).

Here's a query to search the Docusaurus repo for issues and PRs that include the word "bug.”

{
search(query: "repo:facebook/docusaurus bug", type: ISSUE, first: 10) {
edges {
node {
... on PullRequest {
title
number
body
url
}
... on Issue {
title
number
body
url
}
}
}
}
}

We could replace repo:facebook/docusaurus with owner:facebook to scope search every repo owned by Facebook (that we have access to).

You can replace the searchScope with your organization or repo name when applying the changes below. Be sure to swap out the placeholder YOUR_GITHUB_ACCESS_TOKEN with your token. In a future post, we'll cover language server configuration to pass in our search scope and access token.

import fetch from "node-fetch";

type Edge = {
node: {
title: string;
number: number;
url: string;
body: string;
};
};

type Response = {
data: { search: { edges: Edge[] } };
};

// Replace with your real GitHub access token
const accessToken = "YOUR_GITHUB_ACCESS_TOKEN";

const searchScope = "repo:facebook/docusaurus";

const search = async (input: string): Promise<Response> => {
const query = `
{
search(query: "${searchScope} ${input}", type: ISSUE, first: 10) {
edges {
node {
... on PullRequest {
title
number
body
url
}
... on Issue {
title
number
body
url
}
}
}
}
}
`;

const response = await fetch("https://api.github.com/graphql", {
method: "POST",
body: JSON.stringify({ query }),
headers: {
Authorization: `Bearer ${accessToken}`,
},
});

if (!response.ok) {
const error = {
status: response.status,
statusText: response.statusText,
body: await response.json(),
};

connection.console.error(
`Error fetching from GitHub: ${JSON.stringify(error)}`,
);
}

return await response.json();
};

// ...

connection.onCompletion(async () => {
const input = "bug";

const json = await search(input);

const items = json.data.search.edges.map((edge) => {
return {
label: `#${edge.node.number}: ${edge.node.title}`,
detail: `${edge.node.title}\n\n${edge.node.body}`,
insertText: edge.node.url,
};
});

return {
isIncomplete: true,
items,
};
});

Note the isIncomplete: true here. This tells the editor that the list we're returning isn't exhaustive and might change over time.

Our language server works!

vs-code example 2

But it uses our hard-coded search string "bug" instead of completing based on our input. Let's fix that.

connection.onCompletion takes a CompletionParams argument that looks something like this:

{
"textDocument":{"uri":"file:///private/tmp/example_file.rb"},
"context":{"triggerKind":3},
"position":{"line":2,"character":11}
}

With this information and the documents we initialized earlier, we have everything we need to understand what the user was typing.

connection.onCompletion(async (params) => {
const doc = documents.get(params.textDocument.uri);

if (!doc) {
return null;
}

const line = doc.getText().split("\n")[params.position.line];

// return early if we don't see our trigger character
if (!line.includes("#")) {
return null;
}

const input = line.slice(line.lastIndexOf("#") + 1);

// ...
vs-code example 3
vs-code example 4

After selecting our completion choice, you’ll notice that the # character hangs around. How do we prevent this? And why do we need a trigger character anyway?

If we didn't have a trigger character, this completion would trigger constantly as we type any code. That's wasteful for API requests and means we're doing unnecessary work -- we only want to show issues and PRs in very specific scenarios. So, the behavior should be opt-in, and a trigger character is beneficial.

To prevent the # from hanging around, we can replace our naive insertText with a TextEdit. TextEdits allow you to specify a range in the document to replace with new text. We'll modify our completion item formatting function:

const items = json.data.search.edges.map((edge) => {
return {
label: `#${edge.node.number}: ${edge.node.title}`,
detail: `${edge.node.title}\n\n${edge.node.body}`,
textEdit: {
range: {
start: {
line: params.position.line,
character: line.lastIndexOf("#"),
},
end: {
line: params.position.line,
character: params.position.character,
},
},
newText: `${edge.node.url}`,
},
};
});
// ...

With this change, we overwrite the # so that only the new content remains.

Final code

import fetch from "node-fetch";
import {
createConnection,
InitializeResult,
TextDocumentSyncKind,
TextDocuments,
} from "vscode-languageserver/node";
import { TextDocument } from "vscode-languageserver-textdocument";

const connection = createConnection();

const documents: TextDocuments<TextDocument> = new TextDocuments(TextDocument);

type Edge = {
node: {
title: string;
number: number;
url: string;
body: string;
};
};

type Response = {
data: { search: { edges: Edge[] } };
};

// Replace with your real GitHub access token
const accessToken = "YOUR_GITHUB_ACCESS_TOKEN";

const searchScope = "repo:facebook/docusaurus";

const search = async (input: string): Promise<Response> => {
const query = `
{
search(query: "${searchScope} ${input}", type: ISSUE, first: 10) {
edges {
node {
... on PullRequest {
title
number
body
url
}
... on Issue {
title
number
body
url
}
}
}
}
}
`;

const response = await fetch("https://api.github.com/graphql", {
method: "POST",
body: JSON.stringify({ query }),
headers: {
Authorization: `Bearer ${accessToken}`,
},
});

if (!response.ok) {
const error = {
status: response.status,
statusText: response.statusText,
body: await response.json(),
};

connection.console.error(
`Error fetching from GitHub: ${JSON.stringify(error)}`,
);
}

return await response.json();
};

connection.onInitialize(() => {
const result: InitializeResult = {
capabilities: {
textDocumentSync: TextDocumentSyncKind.Incremental,
// Tell the client that the server supports code completion
completionProvider: {
// We want to listen for the "#" character to trigger our completions
triggerCharacters: ["#"],
},
},
};

return result;
});

connection.onCompletion(async (params) => {
const doc = documents.get(params.textDocument.uri);

if (!doc) {
return null;
}

const line = doc.getText().split("\n")[params.position.line];

// return early if we don't see our trigger character
if (!line.includes("#")) {
return null;
}

const input = line.slice(line.lastIndexOf("#") + 1);

const json = await search(input);

const items = json.data.search.edges.map((edge) => {
return {
label: `#${edge.node.number}: ${edge.node.title}`,
detail: `${edge.node.title}\n\n${edge.node.body}`,
textEdit: {
range: {
start: {
line: params.position.line,
character: line.lastIndexOf("#"),
},
end: {
line: params.position.line,
character: params.position.character,
},
},
newText: `${edge.node.url}`,
},
};
});

return {
isIncomplete: true,
items,
};
});

// Make the text document manager listen on the connection
// for open, change and close text document events
documents.listen(connection);

// Listen on the connection
connection.listen();

We've only scratched the surface of what language servers can do. There's still plenty of the LSP left to explore.

Read the next article Hands-On LSP Tutorial: Configuration.

If you'd like to be notified when I publish more LSP content, sign up for my newsletter.

Let's talk Tagged Logging vs Structured Logging in Ruby or Rails

· 7 min read
Jeff Dwyer
Jeff Dwyer
Prefab Founder & Engineer

What is Tagged Logging?

Should you be using it? What libraries support it? Is it the same as structured logging?

Let's start with an example. Here's ActiveSupport::TaggedLogging in action.

class Permissions
def get(user)
logger.tagged("Auth API") do
uri = URI("https://auth.example.com/permissions/?user=#{user}")

logger.info { "Fetching #{uri}" }
permissions = Permissions.parse(Net::HTTP.get(uri))
logger.info { "Got permissions #{permissions.to_s}" }
end
end
end

# Log Output
#[Auth API] Fetching https://auth.example.com/permissions/?user=bob
#[Auth API] Got permissions admin, writer, reader

An example from Justin Weiss shows us how we might do this for users:

logger.tagged(current_user_id ? "user-#{current_user_id}" : "user-anonymous") do
logger.debug "Finding people..."
@people = Person.all
logger.debug "Found #{@people.length} people!"
end

# Log Output
#[user-123] Finding people...
#[user-123] Person Load (0.3ms) SELECT "people".* FROM "people"
#[user-123] Found 0 people!

What's Good About Tagged Logging

Good Readability / Grep-ability

It's nice that the log lines for multiple parts of a request have the same tag. That's going to be helpful with ctrl-f locally or grep in production.

It's DRY (Don't Repeat Yourself)

We put the user.id in one place, and it is now in all the log output. We could even put that in an around_action and have it in all logging for our request.

What's Not as Good

Poor Machine Readability

logger.tagged "user-#{user.id}" do
logger.tagged team.name do
logger.info "hello"
end
end

# The plain text version of the log reads nicely
#INFO [user-1] [The Best Team] hello

# But the JSON Log isn't ideal
#{severity: INFO, message: "hello", tags: ["user-123", "The Best Team"]}

Almost every log aggregator will support JSON logging and user-123 won't be as easy to search as {user: 123}. With the structured format you're going to be able to display and search the column user for 123. Additionally, the team name is just floating there without a key. This post Structured logging in Rails lays out the problem well. Does your logging aggregator want:

[2018-05-13T17:51:08.772542] [INFO] [127.0.0.1] [2892] Customer registration error - SSN already exists.

Or

{
"timestamp": "2018-05-13T17:51:08.772542",
"source": "127.0.0.1",
"msg": "SSN already exists.",
"level": "INFO",
"user_id": 2892,
"error_type": "customer_registration"
}

The answer is almost assuredly the latter.

The gem json_tagged_logger gets in the fight here. It takes the same tagging behavior and puts them in a tags key.

Rails.logger.tagged("TAG") do
Rails.logger.tagged("NESTED").info("nested tagged log message")
end

# Log Output
{
"level": "INFO",
"request_id": "914f6104-538d-4ddc-beef-37bfe06ca1c7",
"host": "127.0.0.1",
"my_param": "param value",
"user_id": "99",
"my_custom_header": "some header value",
"tags": [
"TAG",
"NESTED"
],
"msg": "nested tagged log message"
}

If you really like tagging, this is a good move.

🤔 But are these things you're tagging really "tags" or should they be new keypairs? In a practical example, the code is more likely something like this:

Rails.logger.tagged("BillingJob") do
Rails.logger.tagged("User #{user.id}").info("nested tagged log message")
end

and wouldn't that be better JSON as:

{
"class": "BillingJob",
"user": 1234
}

vs

{ "tags": ["BillingJob", "User 1234"] }

If you're nodding along, at this point, you're probably wondering whether maybe we should just write:

logger.info "nested message", user: 1234, class: "BillingJob"

If so, congratulations, you've just invented structured logging!

What's Structured Logging?

As you can see, structured logging is pretty straightforward. It lets us do something like this:

log.info "hello", user: "1", team: "The best team"

# Text Log
# INFO hello user=1, team=The Best Team
# JSON Log
# {severity: INFO, message: "hello", user: 1, team: "The Best Team"}

Hey now, that really is better.

So, what libraries do this? Quite a few, actually. Here's what they look like:

logcraft

logger = Logcraft.logger 'Application'

logger.info 'Log message'
# => {"timestamp":"2022-...","level":"INFO","logger":"Application","pid":80422,"message":"Log message"}

logger.info message: 'User logged in', user_id: 42
# => {"timestamp":"2022-...","level":"INFO","logger":"Application","pid":80422,"message":"User logged in","user_id":42}

I don't really dig having to say message: but it's not the end of the world. Logcraft has around 5k downloads on rubygems as of today.

ougai

Here's an excerpt from the ougai docs:

logger.info('Information!')
#{"name":"main","hostname":"mint","pid":14607,"level":30,"time":"2016-10-16T22:26:48.835+09:00","v":0,"msg":"Information!"}

logger.info({
msg: 'Request', method: 'GET', path: '/login',
format: 'html', controller: 'LoginController',
action: 'new', status: 200
})
#{"name":"main","hostname":"mint","pid":9044,"level":30,"time":"2016-10-28T17:58:53.668+09:00","v":0,"msg":"Request","method":"GET","path":"/login","format":"html","controller":"LoginController","action":"new","status":200}

Again with the msg: but it's not the end of the world. Ougai has around 8.4M downloads on rubygems as of today.

semantic_logger

logger.debug('log this', foo: 'foo', bar: 'bar')
# Text
#DEBUG 2023-09-06 10:31:18 -0400: {foo: foo,bar: bar} log this
# JSON
{"named_tags":{"foo":"foo","bar":"bar"},"name":"Post","message":"log this"}

Semantic Logger has about 12M downloads, and there is also a rails_semantic_logger gem with Rails-specific integrations.

What About Lograge?

Lograge is sort of a structured logger. It does output structured logs for your Rails requests, but it doesn't give you a way to structure your own logs. It's 101M downloads and a proven tool, but I'm not including it here because we're talking about structured logging and tagged logging in general.

So, is Tagged Logger worse than Structured Logging?

Well, yes. Mostly. Honestly I didn't have an opinion before I really dug in and researched this, but in my view structured logging can give us the same benefits as tagged logging, but in a cleaner, more machine-readable way that fits better with modern log aggregators.

🤔 However there is one thing I found valuable with tagged logging and that is nested contexts. It’s a convenient way to propagate context instead of adding it to each log entry. Does using structured logging mean we have to give that up?

No! Fortunately, we can do this in SemanticLogger as well. It looks like this:

logger.tagged {user: 1} do
logger.info "nested"
end

# Log Output
# nested user=1

Could it be better?

My last gripe would be that I'm repeating this context. Isn't this the same context I'm using for my feature flags library, datadog, and sentry?

Sentry.configure_scope do |scope|
scope.set_context(
'user',
{
name: 'Bob Beemer',
id: 1234,
}
)
end

Why do I need to repeat this again for logging? Can't I just do it once?

The Ideal

I ended up writing this post because we're working on a dynamic log library, and I wanted to make sure we had all our bases covered with respect to structured logging and tagged logging.

Semantic logger is pretty darn good, but if we're going to really DRY things up I could reuse the context I use for feature flags. Here's what that might look like.

My proposed ideal code

# application_controller.rb
class ApplicationController < ActionController::Base

around_action do |_, block|
# Put our context together in one place for the whole request
$prefab.with_context({
user: {
key: current_user.tracking_id,
id: current_user.id,
name: current_user.name,
}
}, &block)
end
end

# application.rb
module MyApplication
class Application < Rails::Application
# tell the logger to add the values of these contexts to log messages
logger.add_context_keys "user.id", "user.name"

# or add extra logging context in a block
logger.with_context {runtime: {value: 42}} do
logger.info "hello"

# Feature flag value evaluation uses existing context for user.id and runtime.value
$prefab.get("my-feature-flag")
end
end
end

# Log Output
# INFO hello user.id=1234, user.name=Bob Beemer, runtime_value=42

This is the approach we're planning on, but I'd love to hear your thoughts.

Summary

  1. Tagged logging is nice.
    1. Tagged logging makes decent-looking console output.
    2. Tagged logging requires adding things manually.
    3. Tagged logging is a bit like structured logging, but in a way that log aggregators can't use.
  2. Structured logging is better.
  3. But ideally structured logging can also add structure in a block.
  4. Semantic Logger is a great library that does this, and it's the same approach we're taking at Prefab.

Dynamically Changing log4j or logback log levels in Java

· 7 min read
James Kebinger
James Kebinger
Prefab Founding Engineer

Changing the log level in Java

Programmatically changing the log level in Java is easy. The only up-front hitch is that you just can't do it via SLF4J -- you'll need to use the underlying logging framework.

Log4j has a Configurator class we can use and in Logback we simply get the logger and set the level. Here's what that looks like.

// Log4J
Configurator.setLevel(loggerName, Level.INFO);

// Logback
Logger logger = (Logger)LoggerFactory.getLogger(loggerName);
logger.setLevel(Level.INFO);

But that's not really why you're here, is it?

What you're actually after is changing the log level without restarting the application. What you're actually after is getting more debug information from a production system without having to redeploy or turn off excessive logging that is costing you money in log ingestion costs.

Changing the log level programmatically is only half the battle (or maybe a 1/10th the battle). In any real application, we now we need to figure out how this code gets called.

This challenge is more complex, but it breaks down into two big parts:

  1. Where does the user input the logger and level?
  2. How does this system broadcast this information to all services?

Capturing the user's desire to change the log level

The developer wants more debug information about FooClass. How do we capture this intent? Collecting the changes comes in a few flavors.

An API request to change the levels

Your developer can POST to an internal URL. Something like POST /log-levels?logger=com.example.FooClass&level=DEBUG would work. The question here will be how to broadcast this change to all instances of the service.

A JMX Request to change the levels

Log4j supports JMX to trigger configuration reloads or edit the config file itself. There's even a client GUI! As with using an API request to a custom endpoint, that'll only work one application instance at a time.

A Shared File

Your developer can edit a shared log4j.properties or logback.xml somewhere. This is the most common way to do this, but sharing the file around can be an annoying infrastructure challenge and the behavior if you corrupt the file is not always obvious. Log4j also supports (re)loading configuration from a URI which is still basically just a remote shared file or files.

A Centralized UI

Maybe you build an internal UI or you use something like SpringBoot Admin or Prefab. The Spring Boot Admin UI looks like this:

centralized log level change UI in spring boot

The Prefab UI is similar, giving us a hierarchical view as well as some feedback on log volume at each level.

centralized log level change UI in Prefab

A centralized UI may or may not have knowledge about the loggers that you're using. Prefab has knowledge of both the logger name as well as the frequency they are being used so it is able to render this helpful UI. This is helpful so you don't have to correctly type the logger name, but also so you know how many message/sec are happening at each logger. To do this, you'll need to send aggregate telemetry back to a central location on logging calls.

Broadcasting the change to all instances of the service

Once we've captured the intent to change the log level, we need to broadcast this change to all instances of the service. While some of the approaches like shared files or URI-based configuration will handle this easily, others like the API endpoint approach have shortcomings in this department. Hit that custom logging configuration API, and our load balancer delivered the POST to one instance of our service, and we changed the log level there. But... what about the other instances? Hope that was the one you wanted!

Broadcasting the changes is typically:

Ignoring this problem

We could skip this step and ony changing the log levels on the one instance that received the user intent. Depending on your use case, this may be sufficient. If you only have a single instance, or you are just looking for a sampling of logs it should serve you well. If you have multiple instances or you are looking for a specific log message, this will not work and it may lead to confusion.

Service Discovery

We could implement some type of service discovery to propagate the change to peer application instances. If each instance is aware of the other instances, then we can broadcast the change to all of them. It's unlikely you're going to want to build this out yourself just for this logging use case, but if this is technology you already have in place, it could be a reasonable option.

NFS File Sync / URI Sync

Having our log4j.properties synced over something like NFS and setting clients to monitor/scan the file/URI for changes. Log4j uses <Configuration monitorInterval="30"> to refresh. In Logback this looks like <configuration scan="true" scanPeriod="30 seconds">.

This may be a reasonable option if you already have a shared file system in place, but wouldn't be the first choice for most people.

PubSub

We can listening to a PubSub system for changes and programmatically configuring the logging system using the code above. Your API endpoint could publish a Redis pub/sub and all instances would listen for changes. Sandeep has a full fledged example of this (in Python) in route triggered state update across workers.

This is likely the easiest solution if you are going to DIY. Redis Pub/Sub is pretty easy to use. You'll need to decide on the message format, but it's a pretty straightforward solution.

One wrinkle is that the log level change will reset as instances reboot. Pub/Sub is fleeting. Instances that are listening at the time of the change will set their levels, but new instances that start afterwards will not see the change. If you want new instances to pick up the change, you'll need use something like Kafka or Redis Streams which will persist the message and allow new instances to pick up the change.

Filter & Dynamic Configuration

The last option is a bit different. Rather than listen for changes and set the log level, we can use a log filter to decide whether or not to log a message and have this filter look up the current log level by looking into a dynamic configuration system.

This dynamic configuration system will use some form of pub sub to ensure its working from the most current configuration, so this could also be seen as a variation of #4, but it's distinct in that this pub/sub system is not a 1-off just for logging. This is what Prefab does, specifically, we use SSE to get the changes and then a Logback TurboFilter that looks up the current value. Pseudo code for this looks like:

 public FilterReply decide(
Marker marker,
Logger logger,
Level level,
String s,
Object[] objects,
Throwable throwable
) {
Optional<Prefab.LogLevel> loglevelMaybe = dynamicConfig.getLogLevel(logger);
if (loglevelMaybe.isPresent()) {
Level calculatedMinLogLevelToAccept = LogbackLevelMapper.LEVEL_MAP.get(
loglevelMaybe.get()
);
if (level.isGreaterOrEqual(calculatedMinLogLevelToAccept)) {
return FilterReply.ACCEPT;
}
return FilterReply.DENY;
}
return FilterReply.NEUTRAL;
}

Implementation as a filter has the advantages of

  1. Gathering information about log requests, whether or not they make it to a log file
  2. Allows custom log levels based on information beyond classname, like application state or local context.
  3. Filters have more context so you can log at DEBUG only for a certain user, instead of just a certain class.

To install this filter check out the set up dynamic logging with logback.

Summary

Dynamic logging is a great way to get more information out of your production system without having to redeploy.

At first, the problem looks like a simple question of figuring out how to change the log level programatically, but as we get into the real world we see that the real challenge is:

  1. Building an ergonomic solution for our developers to input their desired log levels
  2. Propagating this change across our service instances

Building this ourselves is very doable. Adding a POST endpoint to our services and using a Redis Pub/Sub to broadcast the change is a perfectly viable solution. Alternatively a service like Prefab will give us the capability out of the box, with some nice bells and whistles like a UI, log volume information and advanced targeting.