Time-series Data rollups without in-database date functions

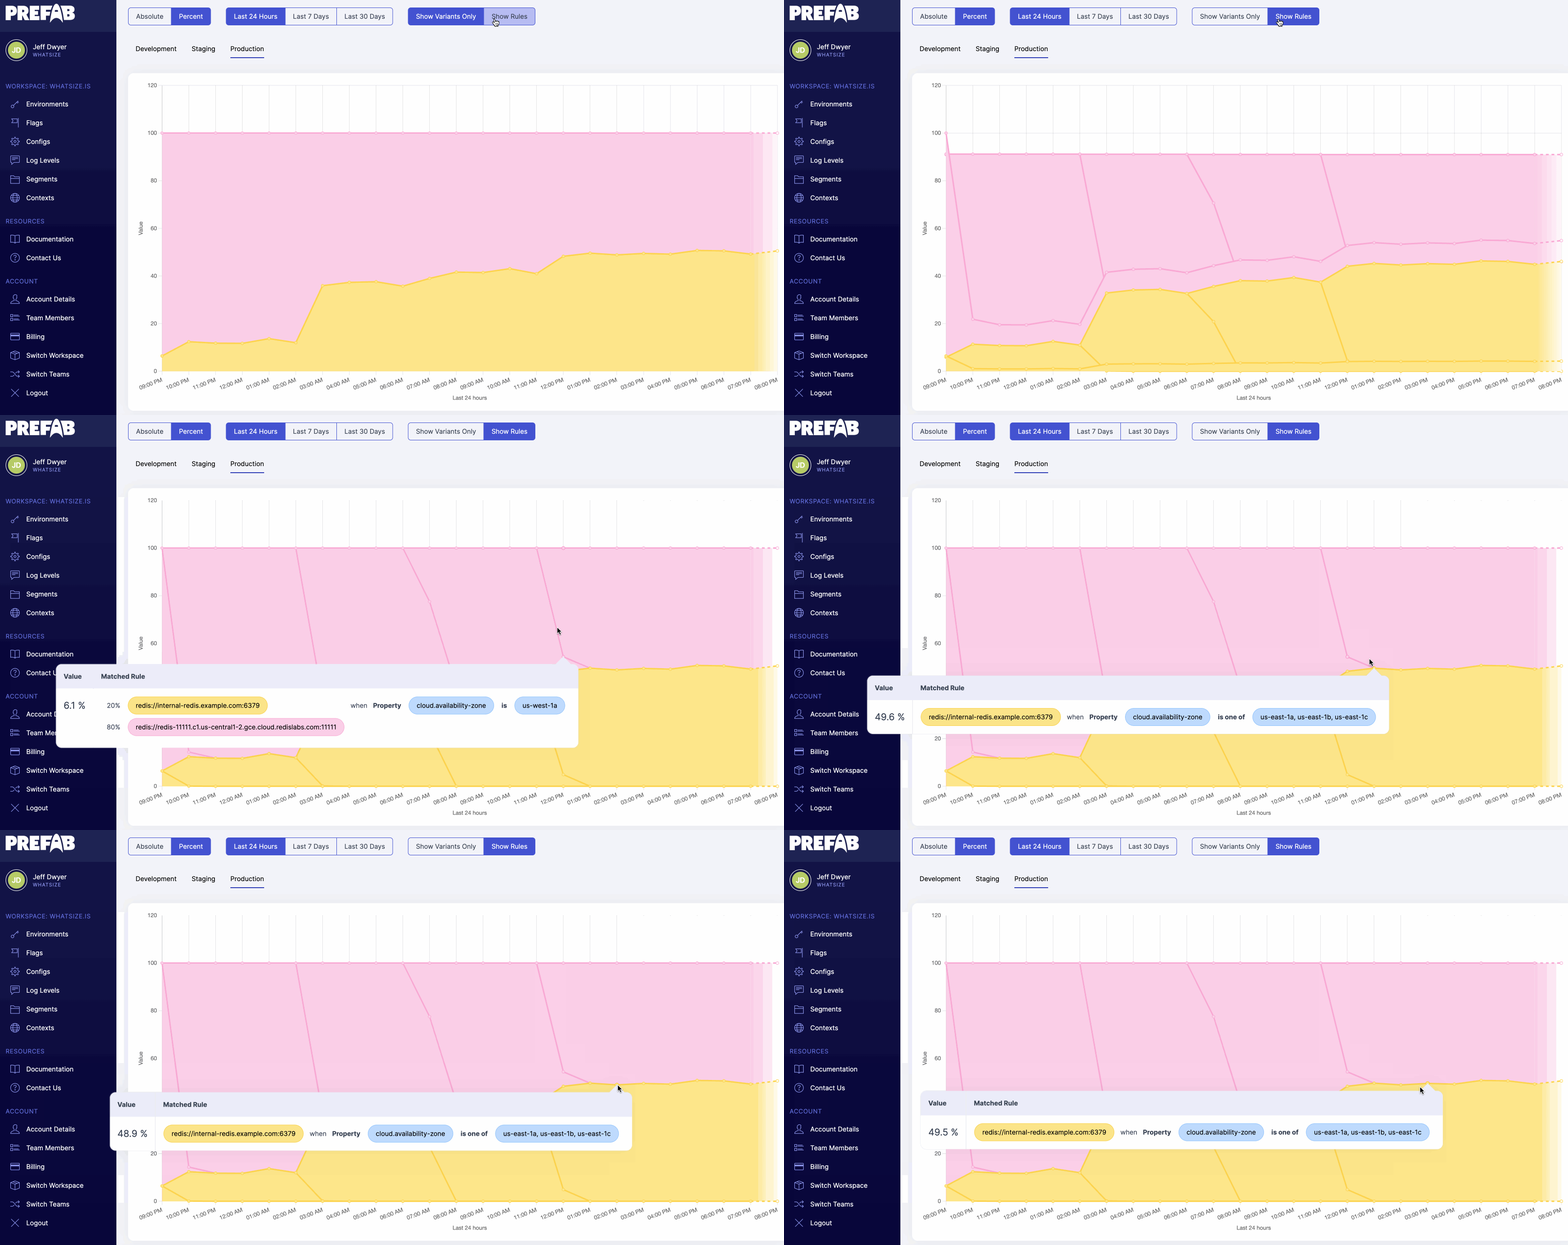
Prefab’s feature flag evaluation charts let you see the distribution of feature flag evaluations over time - nice to see when those configurations have changed or to see automatic rollouts proceed.
How Does It Work (With Date Function)
- The clients send telemetry to Prefab HQ containing evaluation counts in short time windows (5-15 seconds), which we store as-is in a (GoogleSQL-dialect) spanner table [^1]. Each row contains
start_atandend_attimestamps plus counts and various data about the evaluation. - At query time, we truncate each row’s
start_attimestamp to the start of the hour (or day, week) in the user’s timezone using thetimestamp_truncmethod [^2] and sum the counts, grouping by the truncated timezone like this (simplified) query
SELECT
timestamp_trunc(start_at, HOUR, ‘America/Chicago),
config_id,
 …
SUM(count)
FROM table_name
GROUP BY 1,2
- That gives us all the time intervals that have data - but will completely exclude any time intervals that don’t have any rows in them.
The front-end charting library doesn’t naturally handle sparse data, so to be a nice API, we should fill in the zero intervals. In databases with series-generation functions we can generate all the time intervals and left join the data [^3]. Spanner doesn’t have that so we build the complete set of time intervals in the API code [^4] and then do the equivalent of a LEFT JOIN there.
Again, Without In-Database Date Functions
Faced with the prospect of no date/timestamp truncation method in Postgres-dialect Spanner, I switched this use-case to use GoogleSQL dialect. [^5]. A few days later when I was solving the missing time interval problem (see above) I had a lightbulb moment where I saw how I could do the same truncation without timestamp_truncand friends, and potentially more flexibly.
Starting with the assumption that all the rows containing data have a start_at column in UTC milliseconds:
-
Use a date library in your application to convert the user’s selected start time into a UTC timestamp (call this
chart_start_at) -
Calculate milliseconds in each selected time period (eg 1 hour = 3,600,000 mills) - this is our
interval_ms. -
Subtract
chart_start_atfrom everystart_atand then use integer division to calculate integral multiples of offset from the start time.start_at - chart_start_at / interval_ms -
Group and sum the data by those integral offsets. In GoogleSQL-dialect Spanner that’ll look like this (where
1692907200000is thechart_start_atand3600000is an hourSELECT
SELECT DIV((start_at-1692907200000),3600000) as start_at_interval_muliples,
config_id,
…
SUM(count)
FROM table_name
WHERE start_at >= 1692907200000 ...
GROUP BY 1,2 -
This will generate a series of rows with multiples of the offsets since the start time. You’ll need to reconstitute those to real timestamps at some point, either in SQL or your application. To do that just multiply by the offset and add the start time again
(start_at - chart_start_at / interval_ms) * interval_ms + chart_start_at
One nice thing about this approach is its easy to customize the interval time beyond what may be possible using an in-database function - want to rollup in database to 4 hour intervals? Go for it!
Notes:
[^1] One day it’ll make sense to periodically pre-roll up this data to eg 15 minute intervals but we done that yet. Note 15 minutes is the largest practical pre-rolled up data interval because there are timezones with hour+-15 minute offsets from UTC
[^2] Timestamp_trunc spanner docs
[^3] I used and wrote about this approach a couple of jobs ago
[^4] Our time span generator
[^5] Not the only reason! See Friends Don’t Let Friends Use PostgreSQL Dialect Google Spanner
