31 posts tagged with "Engineering"

View All Tags

Resiliency Through Dynamic Health Check Configuration

· 5 min read
James Kebinger
James Kebinger
Prefab Founding Engineer

A health check is a page or endpoint that can indicate whether an application can properly serve requests. Health checks are a useful diagnostic mechanism and it’s handy to have them for all of your application’s dependencies. On the other hand, a failing health check can prevent your application instances from serving requests unaffected by the failing dependency, to the point of complete downtime. How to keep your application’s instances or pods healthy in the face of failing health checks?

There’s a fair amount written on the topic of health check management already (some links below), including approaches such as these:

  • Break down services to have simpler functionality to dependency graphs
  • Categorize your critical dependencies differently from your nice-to-have dependencies
  • Separate liveness checks from readiness checks
  • Think about failing-open vs closed when all health checks have gone bad

The Problem

These are the right approaches, but it's tough to get them right on the first shot. In practice this require a fair amount of tuning work to dial in the right behavior. The upshot is that it's fairly common to end up in a situation where a health check starts failing and your application instances or pods are withdrawn from service, but you'd prefer to keep them up and running.

This Redis healthcheck is failing and taking our pods out of service, but the apps are still mostly functional. How do we fix this immediately?

Malleability To The Rescue

To deal with a problem right now, we took an alternative approach: dynamically manage an ignore-list of health checks that will be excluded from aggregation into an overall health status.

We recently encountered an issue with one of our Redis hosts which caused downtime in our staging environment as pods considered unhealthy were withdrawn from service (despite not affecting most core functionality). Once we realized what’s going on, I quickly subclassed Micronaut's DefaultHealthAggregator and created a dynamically configured ignore list to exclude certain health checks. I also added logging to gain better visibility into failing health checks. These changes will give us more visibility and flexibility to quickly handle similar dependency failures in the future.

Micronaut Health Checks Example

@Singleton
@Requires(beans = HealthEndpoint.class)
@Replaces(bean = DefaultHealthAggregator.class)
public class PrefabHealthAggregator extends DefaultHealthAggregator {

private static final Logger LOG = LoggerFactory.getLogger(PrefabHealthAggregator.class);
private static final String CONFIG_KEY = "micronaut.ignored.health.checks";
private final Value<List<String>> ignoredCheckNames;

public PrefabHealthAggregator(
ConfigClient configClient,
ApplicationConfiguration applicationConfiguration
) {
super(applicationConfiguration);
this.ignoredCheckNames = configClient.liveStringList(CONFIG_KEY);
}

@Override
protected HealthStatus calculateOverallStatus(List<HealthResult> results) {
List<String> ignoredResultNames = ignoredCheckNames.orElseGet(Collections::emptyList);

return results
.stream()
.filter(healthResult -> {
if (ignoredResultNames.contains(healthResult.getName())) {
LOG.warn(
"Ignoring health check {} with status {} and details {} based on prefab config {}",
healthResult.getName(),
healthResult.getStatus(),
healthResult.getDetails(),
CONFIG_KEY
);
return false;
}
if (healthResult.getStatus() != HealthStatus.UP) {
LOG.warn(
"Unhealthy status for healthcheck {} with status {} and details {}. To ignore add name to prefab config {}",
healthResult.getName(),
healthResult.getStatus(),
healthResult.getDetails(),
CONFIG_KEY
);
} else {
LOG.debug(
"passing health result named: {} with status {} and details {}",
healthResult.getName(),
healthResult.getStatus(),
healthResult.getDetails()
);
}
return true;
})
.map(HealthResult::getStatus)
.sorted()
.distinct()
.reduce((a, b) -> b)
.orElse(HealthStatus.UNKNOWN);
}
}

Ignoring a Health Check & Verifying It Works

Now in dynamic configuration we can add a list of health checks to ignore. We'll create a List<String> with the name micronaut.ignored.health.checks and then add the name of the health check we want to ignore. For testing, let's add redis to the list in staging.
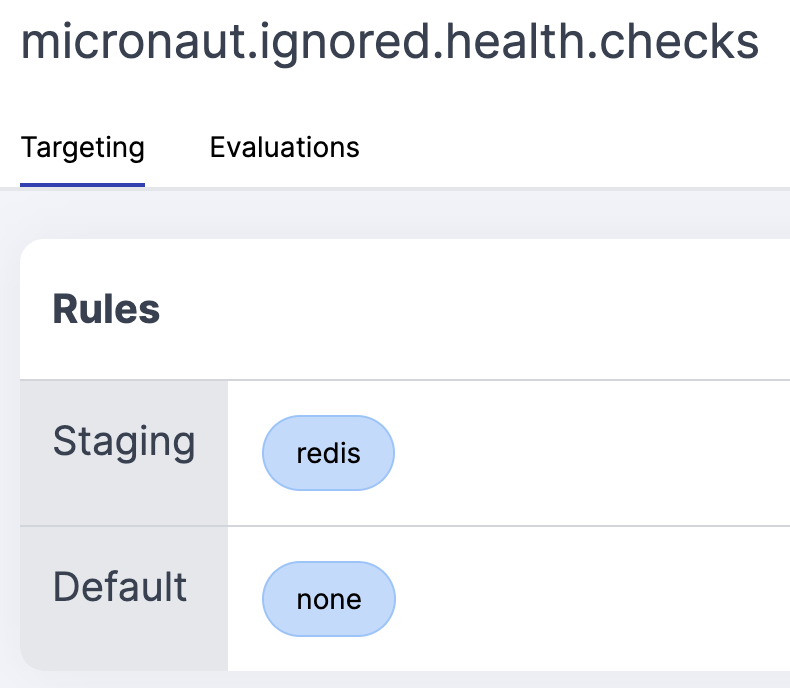
healthchecks that are ignored

Dynamic configuration will propagate this value out to all connected SDKs. But how do we know that it's all working? Well, luckily for us we have some useful debug logging. To verify that it's working, we can turn on debug logging for the PrefabHealthAggregator class in staging using dynamic logging.
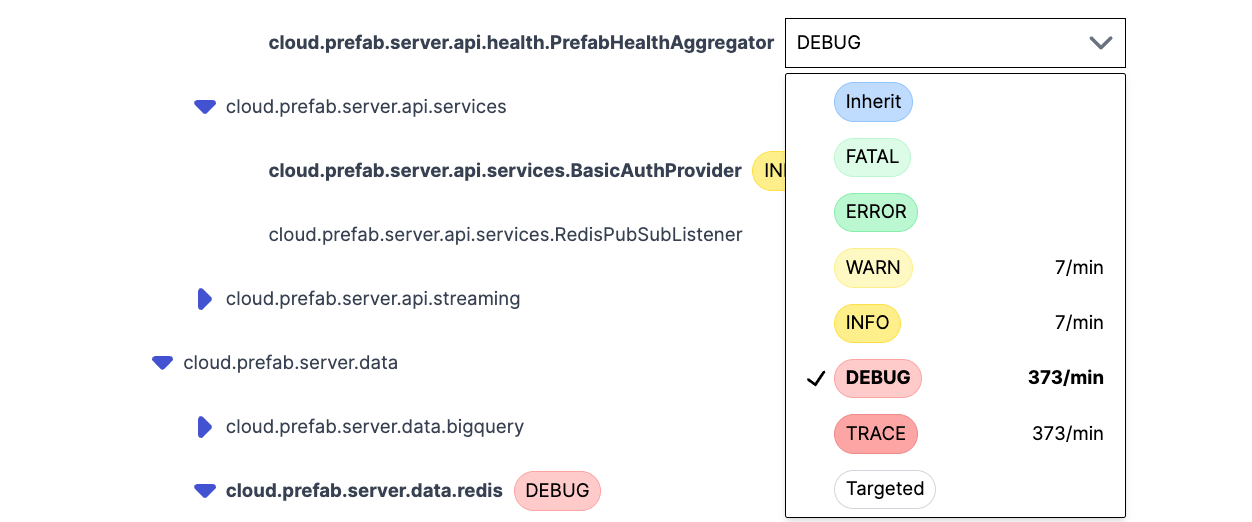
healthchecks for logging

Then we can look over in our logging aggregator and see that the health checks are being ignored:


WARN 10:52:10 Ignoring healthcheck redis with status UP and details {} based on prefab config micronaut.ignored.health.checks

DEBUG 10:52:10 passing healthcheck grpc-server with status UP and details {host=localhost, port=60001}

DEBUG 10:52:10 passing healthcheck diskSpace with status UP and details {total=101203873792, free=49808666624, threshold=10485760}

DEBUG 10:52:10 passing healthcheck service with status UP and details null

DEBUG 10:52:10 passing healthcheck compositeDiscoveryClient() with status UP and details {services={}}

DEBUG 10:52:10 passing healthcheck jdbc:postgresql://1.1.1.1:5432 with status UP and details {database=PostgreSQL, version=15.2}

Summary

Healthchecks are great, but they take some tuning to get right. Unfortunately, getting these wrong can cuase unnecessary downtime.

Luckily, we can use dynamic configuration to quickly tune our healthchecks to get the right behavior as quickly as possible.

Making Front End Logging Useful

· 8 min read
Jeffrey Chupp
Jeffrey Chupp
Prefab Founding Engineer. Three-time dad. Polyglot. I am a pleaser. He/him.
Lost in an avalanche of needles

Front-end logging can feel like finding a needle in an avalanche of haystacks.

Since the browser is the bridge between user interaction and the back-end, front-end logs have the potential to be a treasure trove of insights.

Datadog and others offer browser log collections but everyone I’ve talked to that has tried this has turned it off. Why? Way too expensive.

How can we get meaningful signal from our front-end logging? Three steps:

  1. Transports: We need to put some logic between the log statement and the aggregator. Learn how to direct your logs to the right places and why it matters.
  2. Context: We need to give that logic context, so it can decide what it shouldLog. Crafting actionable error messages and adding the right context will make your logs meaningful.
  3. Targeting: We need some rule evaluation for Laser targeting. We’ll go over how to selectively capture logs for troubleshooting without overwhelming your system.

Transports: Sending the right logs to the right places

Step one in front-end logging is figuring out how to get access to the content. It doesn't matter how good your logging is if it only exists in your end-user's browser.

You'll likely want to sign up with a SaaS for log aggregation rather than rolling your own. We'll use Datadog as our example.

After following the installation steps for @datadog/browser-logs, you're able to use datadogLogs.logger.info (or error, or debug, etc.) wherever you'd normally use console.log.

🤔 We probably don't want to replace console.log entirely, right? For local development, it'd sure be nice to see the logs in my browser rather than going to the Datadog UI.

This is where we start thinking in "transports." There's no reason all our logging should go to the same places. Instead, we can have a logger with intelligent routing. This opens up possibilities like

  • Everything in local dev stays local in the console. Nothing is suppressed.
  • Production shows only ERROR messages in the console. Less severe messages don't show up.
  • Production sends anything INFO or more severe to Datadog.

Here's a rough sketch of what this might look like:

const ERROR = 0;
const INFO = 1;
const DEBUG = 2;

const severityLookup = {
[ERROR]: "error",
[INFO]: "info",
[DEBUG]: "debug",
};

const datadogTransport = (severity, message) =>
datadog.logger[severity](message);

const consoleTransport = (severity, message) => console[severity](message);

export const logger = (environment) => {
const transports = [];

if (environment === "production") {
transports.push([datadogTransport, { minSeverity: INFO }]);
transports.push([consoleTransport, { minSeverity: ERROR }]);
} else {
transports.push([consoleTransport]);
}

const report = (severity, message) => {
transports.forEach(([transport, options]) => {
const { minSeverity } = options || {};
if (minSeverity === undefined || severity <= minSeverity) {
transport(severityLookup[severity], message);
}
});
};

return {
debug: (message) => {
report(DEBUG, message);
},
info: (message) => {
report(INFO, message);
},
error: (message) => {
report(ERROR, message);
},
};
};

To easily compare levels, we treat them as numbers. How many log levels you want and what they should be is a subject of some debate

Context is King

There's an art to crafting a good error message.

Without further details, "Something went wrong during checkout" is inactionable and likely to frustrate the developer on the receiving end.

"[checkout]: Charge has an invalid parameter" is a better message but still not yet actionable. Who did this happen to? What were they trying to buy?

Our logs are most actionable when we couple a well-crafted error message with metadata about the state of the user and app. Datadog and other offerings support this metadata out-of-the-box.

Consider the following

logger.error("[checkout]: charge has an invalid parameter", {
customerId: "cus_9s6XKzkNRiz8i3",
cart: { plan: "Pro", credits: desiredCredits },
});

This logs something like

ERROR: [checkout]: Charge has an invalid parameter | customerId=cus_9s6XKzkNRiz8i3 cart.plan="Pro" cart.credits=-10

They tried to buy the Pro plan and -10 credits? -10 looks weird! That's a thread to pull on.

Adding context to our example logger implementation is easy enough. We can just add an extra context variable (already supported by @datadog/browser-logs) throughout.

Updated code

const ERROR = 0;
const INFO = 1;
const DEBUG = 2;

const severityLookup = {
[ERROR]: "error",
[INFO]: "info",
[DEBUG]: "debug",
};

const datadogTransport = (severity, message, context) =>
datadog.logger[severity](message, context);

const consoleTransport = (severity, message, context) =>
console[severity](message, context);

export const logger = (environment) => {
const transports = [];

if (environment === "production") {
transports.push([datadogTransport, { minSeverity: INFO }]);
transports.push([consoleTransport, { minSeverity: ERROR }]);
} else {
transports.push([consoleTransport]);
}

const report = (severity, message, context) => {
transports.forEach(([transport, options]) => {
const { minSeverity } = options || {};
if (minSeverity === undefined || severity <= minSeverity) {
transport(severityLookup[severity], message, context);
}
});
};

return {
debug: (message, context) => {
report(DEBUG, message, context);
},
info: (message, context) => {
report(INFO, message, context);
},
error: (message, context) => {
report(ERROR, message, context);
},
};
};

We ship our logger and everything is working great. Developers are adding more logging and it is easier than ever to track down issues in local dev. But since we're being strategic about what gets shipped to Datadog, we're not paying for those console.debug lines.

Laser Targeting

We start getting reports that the activity feed is broken for the user with trackingId=abc-123. How can we use our approach to access the DEBUG-level logs for this user without recording those same DEBUG-level logs for every user?

You could tweak the report innards to consider the context:

const TRACKING_IDS_TO_ALWAYS_LOG = ["abc-123"];

const report = (severity, message, context) => {
transports.forEach(([transport, options]) => {
const { minSeverity } = options || {};
if (
minSeverity === undefined ||
severity <= minSeverity ||
TRACKING_IDS_TO_ALWAYS_LOG.includes(context.trackingId)
) {
transport(severityLookup[severity], message, context);
}
});
};

This gives us a nice mechanism for allow-listing certain tracking ids for verbose logging.

logger.debug("test", { trackingId: user.trackingId });

// Examples
logger.debug("test", { trackingId: "abc-123" }); // This is sent to Datadog (trackingId matches)
logger.debug("test", { trackingId: "xyz-999" }); // This is not sent

A hard-coded array of tracking ids means we'll need to PR, merge, deploy, etc. to get this change out, but this is still a powerful approach. We'll get all the details we need to fix the user's problem. Once fixed, we can remove their tracking id from the array and do the PR/merge/deploy dance once more.

Dynamic Targeting with Prefab

That all works great. You can call it a day and move on, confident and happy that enabled yourself and other devs to log better than ever.

But let me offer you a superpower: Sign up for Prefab and install @prefab-cloud/prefab-cloud-js (or the react flavor). Now you can target based on any context data to just the right logs to just the right places -- without having to change any code after the initial setup.

Here's the changes needed to start using prefab.shouldLog

import { prefab, Context } from "@prefab-cloud/prefab-cloud-js";

// Set up prefab with the context of the current user
const options = {
apiKey: "YOUR-API-KEY-GOES-HERE",
context: new Context({
user: { trackingId: "abc-123", email: "test@example.com" },
device: { mobile: true },
}),
};
prefab.init(options);

// ...

export const logger = (environment, loggerName) => {
// ...
const report = (severity, message, context) => {
transports.forEach(([transport, options]) => {
const { defaultLevel } = options || {};

// Use prefab to check if we should log based on the user context
if (
prefab.shouldLog({
loggerName,
desiredLevel: severityLookup[severity],
defaultLevel: severityLookup[defaultLevel] ?? "debug",
})
) {
transport(severityLookup[severity], message, context);
}
});
};
// ...

Now we can use the tools in the Prefab UI to target trackingId abc-123 and add and remove users without shipping code changes. Because you can set up custom rules to target whatever you provide in your context, we can even do things like target specific users on specific devices.

Full updated code

import { prefab, Context } from "@prefab-cloud/prefab-cloud-js";

// Set up prefab with the context of the current user
const options = {
apiKey: "YOUR-API-KEY-GOES-HERE",
context: new Context({
user: { trackingId: "abc-123", email: "test@example.com" },
device: { mobile: true },
}),
};
prefab.init(options);

const ERROR = 0;
const INFO = 1;
const DEBUG = 2;

const severityLookup = {
[ERROR]: "error",
[INFO]: "info",
[DEBUG]: "debug",
};

const datadogTransport = (severity, message, context) =>
datadog.logger[severity](message, context);

const consoleTransport = (severity, message, context) =>
console[severity](message, context);

export const logger = (environment, loggerName) => {
const transports = [];

if (environment === "production") {
transports.push([datadogTransport, { defaultLevel: INFO }]);
transports.push([consoleTransport, { defaultLevel: ERROR }]);
} else {
transports.push([consoleTransport]);
}

const report = (severity, message, context) => {
transports.forEach(([transport, options]) => {
const { defaultLevel } = options || {};

// Use prefab to check if we should log based on the user context
if (
prefab.shouldLog({
loggerName,
desiredLevel: severityLookup[severity],
defaultLevel: severityLookup[defaultLevel] ?? "debug",
})
) {
transport(severityLookup[severity], message, context);
}
});
};

return {
debug: (message, context) => {
report(DEBUG, message, context);
},
info: (message, context) => {
report(INFO, message, context);
},
error: (message, context) => {
report(ERROR, message, context);
},
};
};

Wait, you forget to tell me which logging library to install!

You might not need one. I'd hold off picking until I knew more about why I wanted one.

IMHO, there isn't a clear winner. Since the major players (e.g. pino and winston) support you providing your own transports, you can pick whichever you prefer and always change your mind later.

Friends Don’t Let Friends Use PostgreSQL Dialect Google Spanner

· 3 min read
James Kebinger
James Kebinger
Prefab Founding Engineer

Google Spanner is a remarkable piece of technology. It’s a globally distributed, strongly consistent, relational database that scales horizontally with a 99.999% SLA. With the recent addition of granular instance sizing, it's now possible to start with spanner at $40/month andnder the hood it even uses atomic clocks! How cool is that?

If you decide to try Spanner, right off the bat you've got to choose between two dialects, and it's not clear which one is the best choice.

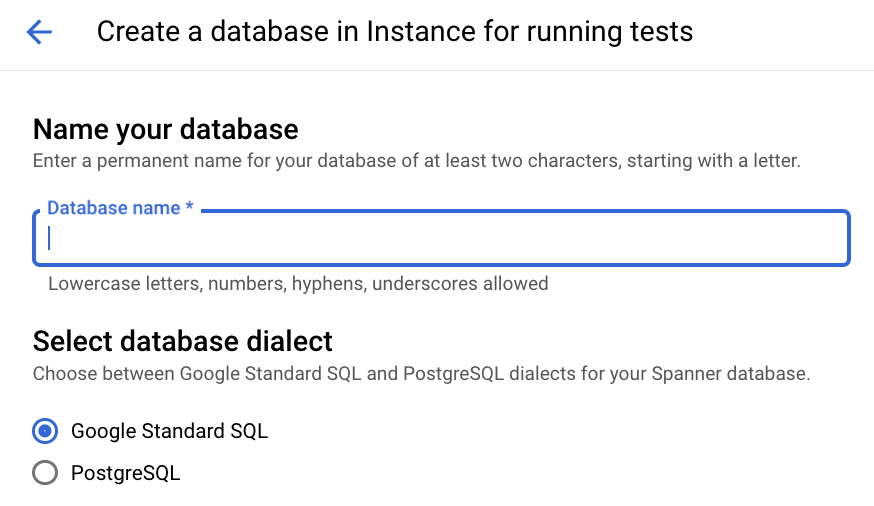
choose your fighter

Spanner comes in two flavors, GoogleSQL(an ANSI-compliant SQL) and PostgreSQL. Unfortunately it's a permanent choice on a per-database basis and it will have significant impact on the code you write, so you need to choose wisely!

Google provides a guide that can help you make an informed decision regarding the choice between PostgreSQL and GoogleSQL, along with a description of the features and limitations of Postgres that are and are not supported. These documents are a good starting point for your decision-making process.

we chose poorly

As a long-time fan of Postgres, I was initially happy that we had chosen the PostgreSQL dialect. However, after becoming more familiar with its limitations compared to GoogleSQL, the PostgresSQL dialect feels like a second-class citizen in Google Spanner. Therefore, we have recently started creating new tables in a GoogleSQL dialect database instead. Here are the details of our experience.

Poor Selection of Functions

Spanner implements many Postgres functions, but when I started to do some in-database rollups of data within time windows and so quickly reached for good old date_trunc and found it unimplemented along with date_bin. The list of supported postgres datetime methods is short and undistinguished. GoogleSQL has much better date time functions

If you think you might query by date or timestamp in your database, you should probably use GoogleSQL.

Missing PostgreSQL Emulator

Google has a spanner emulator runnable from a docker image for the GoogleSQL dialect which will enable cheap, conflict free testing in local and CI/CD environments. PostgresSQL dialect users must pay to run tests against real Spanner database instances with all the headaches that come with that approach. There’s an issue but its been almost a year since the last update.

Named Placeholder Support

The PostgreSQL spanner driver makes you write ugly code like this to build statements

Statement.Builder builder = Statement
.newBuilder("SELECT * FROM cool_table WHERE project_id = $1 AND id >= $2")
.bind("p1")
.to(projectId)
.bind("p2")
.to(startAt);

GoogleSQL spanner driver lets you use this much more pleasant named placeholder approach

Statement.Builder builder = Statement
.newBuilder("SELECT * FROM cool_table WHERE project_id = @projectId AND id >= @id")
.bind("projectId")
.to(projectId)
.bind("id")
.to(startAt);

This distinction is documented here

Your Mileage May Vary

The PostgresSQL dialect might be a good fit for an application already using postgres that also happens not to use any of the missing postgres features. For us, the compatibility isn’t quite there so we’ll be steadily moving towards GoogleSQL

Time-traveling Ruby Logger

· 5 min read
Jeffrey Chupp
Jeffrey Chupp
Prefab Founding Engineer. Three-time dad. Polyglot. I am a pleaser. He/him.

Wouldn't it be great if you could log all of the gory details of a request, but only if it fails?

Choosing the appropriate logging level for our web app can be challenging. Specifying the DEBUG level yields detailed information, but the signal for failed requests can get lost in the noise of successful ones. A WARN level reduces volume but lacks detail to help track down bugs.

Take this example:

Rails.log_level = :warn

class CriticalBusinessCode
def calculate_grumpkin_quotient(apples, bananas)
log.debug "calling fruit api with #{apples}, #{bananas}" # :( no info
FruitApi.call(apples, bananas) # <= Throws mysterious "400 Bad Request"
end
end

If we knew at the beginning of a request that it would fail, we'd set the log level to DEBUG (or even TRACE), right?

We don't have the technology to build a psychic Logger, but we can build the next-best thing: a Time-traveling Logger.

Time Traveling Logger

A first version

Let's start with the core Ruby Logger. Here's how it is used without modification.

require 'logger'

logger = Logger.new($stdout)
logger.level = Logger::WARN

logger.debug "DEBUG"
logger.info "INFO"
logger.warn "WARN"
logger.error "ERROR"

We told the logger ahead of time that we wanted WARN as our level. Because we set the level to WARN, we only see the WARN and ERROR output, not the DEBUG and INFO output.

How can we build on top of the core logger to allow specifying the level later in the program's execution — after some logging statements have already executed?

Queued logging

The key idea is to defer flushing the logs until the end of the request. We don’t have the context we need to make the verbosity decision up-front, but when the request finishes, we will. We just need a place to stash these logs while the request processes.

Building on top of the core Logger, we can implement a queue by overriding the add method

require 'logger'

class QueuedLogger < Logger
def initialize(*args)
super
@queue = []
end

def add(severity, message = nil, progname = nil)
@queue << -> { super(severity, message, progname) }
end

def flush!(level = nil)
old_level = self.level
self.level = level if level

@queue.each(&:call)
@queue = []
ensure
self.level = old_level
end
end

The implementation here isn't too exciting (in a good way). .debug, .info, etc. call add. With this change, we don’t immediately write the message but instead we throw it in a queue to be logged later.

When we're ready to dump out the logs, we can specify the level we want.

logger = QueuedLogger.new($stdout)
logger.level = Logger::WARN

logger.debug "DEBUG"
logger.info "INFO"
logger.warn "WARN"
logger.error "ERROR"

logger.flush!(Logger::DEBUG)

At flush! time, we look back through history and evaluate the log statements with the provided level.

Despite the level being set to WARN initially, our DEBUG and INFO lines will show up since we're flushing at the DEBUG level.

Example usage

Let’s imagine we’re writing software for managing appointments for physicians. We have a background job to remind patients about upcoming appointments via SMS.

class AppointmentReminderJob
def perform(doctor, patient, time, timezone)
logger.debug "Scheduling appointment for #{doctor} and #{patient} on #{time} in #{timezone}"

message = compose_message(doctor, patient, time, timezone)
SMS.send(message, patient.phone)
end

def compose_message(doctor, patient, time, timezone)
# ...
end

def logger
@logger ||= Logger.new($stdout).tap do |logger|
logger.level = Logger::WARN
end
end
end

If an exception happens when sending the reminder (perform), we’d like as much detail as possible. Unfortunately our default level of WARN means that our logger.debug statement is never written.

We could set the default level to DEBUG. While the logger.debug line here is useful if something goes wrong, it clutters our logs with noise when everything is working as intended.

We can get the best of both worlds by applying our QueuedLogger to capture debug-level messages only when an exception occurs.

Here’s the updated class:

class AppointmentReminderJob
def perform(doctor, patient, time, timezone)
logger.debug "Scheduling appointment for #{doctor} and #{patient} on #{time} in #{timezone}"

message = compose_message(doctor, patient, time, timezone)
SMS.send(message, patient.phone)
rescue => ex
logger.error(ex)
# write at the debug level so we get all the details
logger.flush!(:debug)
ensure
# write at the default level we specified (WARN in this example)
logger.flush!
end

def compose_message(doctor, patient, time, timezone)
# ...
end

def logger
@logger ||= QueuedLogger.new($stdout).tap do |logger|
logger.level = Logger::WARN
end
end
end

When Where do we go from here?

QueuedLogger isn't quite ready to be thrown into your Rails app yet with config.logger = QueuedLogger.new(...). To get ready for prime-time, we'd want to isolate the queue for the request (maybe using ActiveSupport::CurrentAttributes, concurrent-ruby, or RequestStore).

If you're interested in a battle-hardened version of this logger that is ready to use, let us know and I'll see what I can put together :)

There's some interesting discussion happening on Reddit.

Have a great day!

Gem install sassc is always going to be slow. Your Docker builds don't have to be.

· 3 min read
Jeffrey Chupp
Jeffrey Chupp
Prefab Founding Engineer. Three-time dad. Polyglot. I am a pleaser. He/him.

There's an open issue from March of 2020 titled sassc is very slow to compile and install. The issue has people pleading for help and asking for sassc-ruby to ship precompiled binaries (as nokogiri does). The place this hurts the most is building your Rails app with Docker where you can pay a 10+ minute install time every time you modify any part of your Gemfile.lock

Oof.

I have good news for those still stuck on sassc: Your Docker builds don't have to be slow.

Docker enthusiasts know that layer caching is a huge time saver. But modifying your Gemfile.lock breaks your bundle install layer and causes the previous cache to be unusable. Even though sassc has been at version 2.4.0 since June of 2020 and isn't likely to be updated, even a minor version bump on any other gem in your Gemfile means you're reinstalling sassc again.

Fortunately the fix is a trivial change in your Dockerfile: before your RUN bundle install command, add RUN gem install sassc:2.4.0.

The sassc install will be cached as its own Docker layer and then your subsequent bundle install will use the existing sassc from disk.

You can use this strategy for other rarely-changed gems with native extensions for more savings.

Altogether this looks like:

FROM ruby:3.2.1

# 1. Install gems that rarely change or are very slow
ENV RAILS_VERSION 6.1.7.2
RUN gem install rails --version "$RAILS_VERSION"

# pull sassc out and install early so we don't pay the price on each gem change
RUN gem install sassc:2.4.0
RUN gem install bundler


# 2. Install gems that change more frequently
RUN mkdir -p /usr/src/app
WORKDIR /usr/src/app
COPY Gemfile /usr/src/app/
COPY Gemfile.lock /usr/src/app/

# don't bother installing development and test gems
RUN bundle config set --local without 'development test'
RUN bundle install --jobs 4

# 3. Now Move the app code in, because this changes every build
COPY . /usr/src/app

RUN RAILS_ENV=production bundle exec rake assets:precompile

That's it!

For us gem install sassc:2.4.0 inside bundler has saved 8 minutes per build. Hopefully this can help you too.

Speaking of things that are slow, have you ever wanted to change an environment variable variable without restarting your server? Ever wanted to change the log level without pushing a new build? Or perhaps you're simply interested in a fabulous Rails Feature Flag solution that has everything you need, but doesn't charge by the seat? If so, check us out here at Prefab!

Some Opinions on Tracking Users

· 9 min read
Jeff Dwyer
Jeff Dwyer
Prefab Founder & Engineer

Introduction

If you're setting up tracking for a new project, the natural thing to do is follow the instructions from whatever product analytics tool or event hub you're planning to use: Segment / Amplitude / PostHog etc. Each of these will assign a trackingId for you, but I would suggest you take this into your own hands. Let's dive in and see why.

The Standard Solution

The current standard of user identification is basically:

  1. Generate a GUID Cookie for anonymous visitors
  2. Track events against this GUID
  3. On login / account creation. Send an identify call saying userId == guid
  4. When performing analysis do it for all GUIDs and UserIds.

This is how Segment, Amplitude or PostHog works.

I'll get it out of the way now, this is definitely the most complete and "correct" solution. The problem in my eyes is that it's also the most complex to implement, analyze and reason about. And sometimes bad things happen.

The complex method of user identification has gained popularity because on paper it provides a more comprehensive view of user behavior across multiple devices and browsers. By merging anonymous IDs with user IDs, anytime we realize that one set of activity is actually coming from a specific user, we can stitch them together. This sounds great.

The Problems

Challenging Analysis: The core issue is readily apparent from the diagram however. We have 4 different streams. In a data warehouse, this is going to look like 4 different primary keys. In order to do any analysis, we're going to have to union all events from these 4 keys together every time and sort them. In particular because of the changes to how browsers handle cookies, we are going to get lots and lots of tracking_ids per use and at "analytics scale" this can be a non-trivial problem. Over time, trying to select * from events where tracking_id IN (select tracking_id from user_tracking_ids where user_id = 123) can simply fall over.

While this process generally works well within 3rd party tools, this is because it's really one of their core competencies and they have really optimized to solve it. That's great for them, but the problem is this isn't one of your core competencies. If you want to write all the events to the data warehouse, which I think you should, you're going to have a harder time. Now, do you really need to store raw events in your warehouse? It's your call, but I'd strongly encourage it. Owning your data means you control your destiny and being able to dive into the core of the issue with raw data is often key to solving thorny problems.

Interoperability & Portability The other issue is that this method of user identification is less portable. If you want to switch from Posthog to Amplitude, you're likely going to have to re-identify all your users. Similarly if you're looking to move data between systems or describe your data to another system, it's just awkward to not have a single immutable ID for each user. Say you want to build a simple realtime personalization API. You're going to build a kafka listener on your event stream, run some KSQL and save off something like "how many times person X looked at the pricing page". Should this API be responsible for understanding that all 4 GUIDs are actually the same person? That's a lot of work for a simple API.

Bad Merges: Accidental/Incorrect merges are a real thing and can create an amazing amount of confusion. These merge-style systems are greedy. Their whole purpose in life is to join together different streams of the user experience into a unified view. However, a few users share a computer or have multiple accounts and suddenly these systems slurp two users into one and you have a real mess on your hands. Try explaining to everyone why you had 400 users in March last week, but now there are only 396 because your 3rd party analytics system accidentally merged two users. It's not fun.

Even in a "correct merge" situation, very weird things can happen. From the Amplitude docs

When users are merged, the user could "lose" user property values that were never meant to be changed (e.g. 'Start Version' or initial UTM parameters) because the new user property values will overwrite the original user property values. If you are a paying customer and this affects you, please reach out to our Support team.

Not That Useful: The reason this standard solution exists is that we would really love to be able to track an anonymous user across every device and browser they use, before they convert, so we can understand the full acquisition picture. This would be very useful to understand acquisition channels, but sadly it's not on the menu. The reality is that new privacy controls have made this close to impossible. Honestly this isn't a huge change. Even before new browser cookie policies, cross device tracking was dark magic that never really worked that well.

What we do get from this complex approach is typically:

  1. 1 stream of anonymous traffic that converts to a user [very useful]
  2. 5 streams of anonymous traffic that we never associate with a user [sad, but nothing to be done]
  3. 20 streams of anonymous traffic that then logs in. [not very useful]

Our simpler solution is going to give us #1 & #2 above and will track #3 but de-emphasize it.

A Simpler Solution

My preferred solution makes one big sacrifice and reaps a ton of simplicity. Here's the approach pictorially.

We now have a single stream of events for our user and we can select * from events where tracking_id = 'abc123'. This is a lot easier to reason about.

We also have a "marooned" stream. This is what it looks like when an existing user of yours comes to your site and logs in. It is not connected directly to the other stream (but we can connect it if we need to). This is the tradeoff. The core of the reasoning is that, in practice, detailed analysis of this funnel is just not that important. How much analysis happens of the create new user flow? A ton. How much of the login flow? Not much.

Our proposed solution simplifies user identification as follows:

  1. All pages/applications should set the same cookie for new visitors if it's not already set.
  2. Upon signup, transfer the GUID to a single tracking_id field on the user.
  3. On each page load, if a user is defined, set the tracking cookie to the user tracking_id. Otherwise, track using the cookie.
  4. If step #3 would change an existing cookie that means we have a crossover event. Track 2 "transition" events, one in each stream to aid analysis if you'd like.

This approach results in a single GUID per user, making analysis and identification much simpler, especially when it comes to exploring raw data in your data warehouse.

Addressing Potential Concerns

  1. Working with 3rd party tools: Just because we're taking control of the tracking_id doesn't mean we shouldn't use 3rd party analytics tools. All we need to do is identify(trackin_id) and they'll respect our authority on the matter.
  2. Multiple devices and browsers: Post-login activity from different devices can still have the same tracking_id as long as you mobile apps follow the same protocol.
  3. Data loss during transition: Firing "switchover" events helps maintain data in the warehouse, enabling the possibility of stitching data together if needed.
  4. Data privacy and compliance: There's no significant impact on data privacy and compliance with GDPR or CCPA. When you go to delete a user you'll need to delete all this data, but that's true of any solution.

Applicability and Limitations

This simpler solution is well-suited for large B2C and B2B SaaS companies, where acquisition analysis is a priority. However, if re-acquisition is central to your business, this approach may not be the best fit.

Implementation

Here is a suggested implementation in Rails.

The core of the implementation is a class that generates a tracking_id and persists it to cookies. The rest is just plugging it into Rails and saving it to the user on signup.

class TrackingId
COOKIE_KEY = "tid".freeze

def self.build(user:, cookies:)
builder = new(user, cookies)
builder.persist_to_cookies
builder.tracking_id
end

def initialize(user = nil, cookies = {})
@user = user
@cookies = cookies
end
def tracking_id
@tracking_id ||= user_tracking_id || cookie_tracking_id || self.class.new_tracking_id
end

def persist_to_cookies
@cookies[COOKIE_KEY] = {
value: tracking_id,
expires: 1.year.from_now
}
end

private

def user_tracking_id
@user.try(:tracking_id)
end

def cookie_tracking_id
return if @cookies[COOKIE_KEY].blank?
@cookies[COOKIE_KEY]
end

def self.new_tracking_id
SecureRandom.uuid
end
end

All webpages a user might land on, should set the cookie if it's not set already set. Here's an example in JS.

function setGUIDCookie() {
// Check if the tid cookie has already been set
if (document.cookie.indexOf("tid=") === -1) {
const guid = crypto.randomUUID();
const expirationDate = new Date(
new Date().setFullYear(new Date().getFullYear() + 1)
).toUTCString();
document.cookie = `tid=${guid}; expires=${expirationDate}; SameSite=Lax; path=/`;
}
}
setGUIDCookie();

Conclusion

This proposed solution offers a more straightforward approach to user identification for 3rd party tracking systems, simplifying analysis and reducing complexity, particularly when examining raw data in your data warehouse.

This works with all the existing tools like Segment, Amplitude, PostHog, etc. You'll just take control and send them the tracking_id you generate and don't rely on their merge logic.

In my experience, this simpler solution is better and leads to fewer headaches. Taking control of the identity puts you in the driver's seat and makes it easier to analyze across whatever analytics tools you decide to use.

Good luck!

Micrometer Gauges, Datadog and Kubernetes

· 4 min read
Jeff Dwyer
Jeff Dwyer
Prefab Founder & Engineer

I didn't think I'd be writing this.

I really thought it would be a 3 line commit. All I wanted to know was how many streaming connections I had. DataDog was already setup and was happily sending metrics to it, so I figured I'd just add a gauge and be done with it.

But here we are.

A Basic Gauge

Micrometer is a "Vendor-neutral application observability facade" which is Java speak for "a common library of metrics stuff like Counters, Timers, etc" If you want a basic "what is the level of X over time", a gauge is the meter you are looking for.

Here's a basic example of using a Gauge. This is a Micronaut example, but is pretty generalizable.

@Singleton
public class ConfigStreamMetrics {

private final AtomicInteger projectConnections;

@Inject
public ConfigStreamMetrics(MeterRegistry meterRegistry) {
projectConnections =
meterRegistry.gauge(
"config.broadcast.project-connections",
Tags.empty(),
new AtomicInteger()
);
}

@Scheduled(fixedDelay = "1m")
public void recordConnections(){
projectConnections.set(calculateConnections());
}
}

Ok, with that code in place and feeling pretty sure that calculateConnections() was returning a consistent value. You can imagine how I felt looking at the following, which shows my gauge value going all over the place from 0 to 1 to 2 (it should just be 2). All over the place

Why is my gauge not working?

What is happening here? The gauge is all over the place. It made sense to me that taking the avg was going to be wrong, if I have 2 servers I don't want the average of the gauge on each of them, I want the sum. But I'm charting the sum() here and that doesn't exp lain what's happening.

The Key

The key is remembering how statsd with tagging works and discovering some surprising behavior from a default DataDog setup.

Metrics from micrometer come out looking like config.broadcast.project-connections.connections:0|g|#statistic:value,type:grpc.

As an aside, I'd highly recommend setting up a quick clone of statsd locally that just outputs to stdout when you're trying to get this all working.

The "aha" is that all of these metrics get aggregated based on just that string. So if you have

Server 1: config.broadcast.project-connections.connections:99|g|#statistic:value,type:grpc

Server 2: config.broadcast.project-connections.connections:0|g|#statistic:value,type:grpc

A gauge is expecting a single value at any given point, so what we end up with here is a heisengauge that could be either 0 or 99. Our sum doesn't work, because we don't have a two data points to sum across. We just have one value that is flapping back and forth.

The gotcha

Now we know what's up, and it's definitely a sad state of affairs. What we do want is outputting a different key per pod and then summing across those. But why aren't these metrics getting tagged with the pod?

It turns out that https://micronaut-projects.github.io/micronaut-micrometer/latest/guide/#metricsAndReportersDatadog hits DataDog directly, not my local Datadog agent which is normally responsible for adding these host & pod tags.

Since it goes straight there and we aren't explicitly sending a pod or host tag, these metrics are clobbering each other.

Two solutions

1) Point your metrics to your datadog agent and get the host tags that way

This makes a lot of sense, but I wasn't able to get it working easily.

2) Set CommonTags Yourself

The other solution is to calculate the same DataDog hostname that the datadog agent uses and manually add that as a commonTag to our MetricRegistry. Doing that looks like this:

@Order(Integer.MAX_VALUE)
@Singleton
@RequiresMetrics
public class MetricFactory
implements MeterRegistryConfigurer<DatadogMeterRegistry>, Ordered {

@Property(name = "gcp.project-id")
protected String projectId;

@Override
public void configure(DatadogMeterRegistry meterRegistry) {
List<Tag> tags = new ArrayList<>();
addIfNotNull(tags, "env", "MICRONAUT_ENVIRONMENTS");
addIfNotNull(tags, "service", "DD_SERVICE");
addIfNotNull(tags, "version", "DD_VERSION");
addIfNotNull(tags, "pod_name", "POD_ID");

if (System.getenv("SPEC_NODENAME") != null) { // contruct the hostname that datadog agent uses
final String hostName =
"%s.%s".formatted(System.getenv("SPEC_NODENAME"), projectId);
tags.add(Tag.of("host", hostName));
}

meterRegistry.config().commonTags(tags);
}

private void addIfNotNull(List<Tag> tags, String tagName, String envVar) {
if (System.getenv(envVar) != null) {
tags.add(Tag.of(tagName, System.getenv(envVar)));
}
}

@Override
public Class<DatadogMeterRegistry> getType() {
return DatadogMeterRegistry.class;
}
}

Passing the node & pod names in required some kubernetes yaml work so that the pod name and node name were available as environment variables.

spec:
containers:
- image: gcr.io/-----
name: -----------
env:
- name: SPEC_NODENAME
valueFrom:
fieldRef:
fieldPath: spec.nodeName
- name: POD_ID
valueFrom:
fieldRef:
fieldPath: metadata.name

Wrap

With all of that in place we're finally in a good place. Our gauges are independently gauging and our sum is working as expected.

Yay