A Ruby on Rails OOM Mystery: The Case of the Hungry Hippo
I've got a fun sleuthing mystery for you today. Follow along and see if you can figure out what the problem is before the end.
So we're spinning up a new application at Prefab. (We want to offer SAML to our customers. So we're building out a quick authentication app, with the idea that perhaps we also sell this as a service one day.)
This is a brand new Rails app, 3 weeks old. We deploy to kubernetes which is running in GKE autopilot.
- Locally everything working great.
- Staging, everything working great.
- Production... not happy. Pod restart alerts.
What gives?
So first things first, we pull out Lens and see we've got some OOM. Okay, that's annoying and a bit surprising. It's configured for 768Mi and that should be enough since we've got other rails apps doing more with less, so something is weird.
And when I say "running out of memory" I don't mean "slow memory leak". This this is getting killed very quickly. 1, 2 minutes and kaboom.
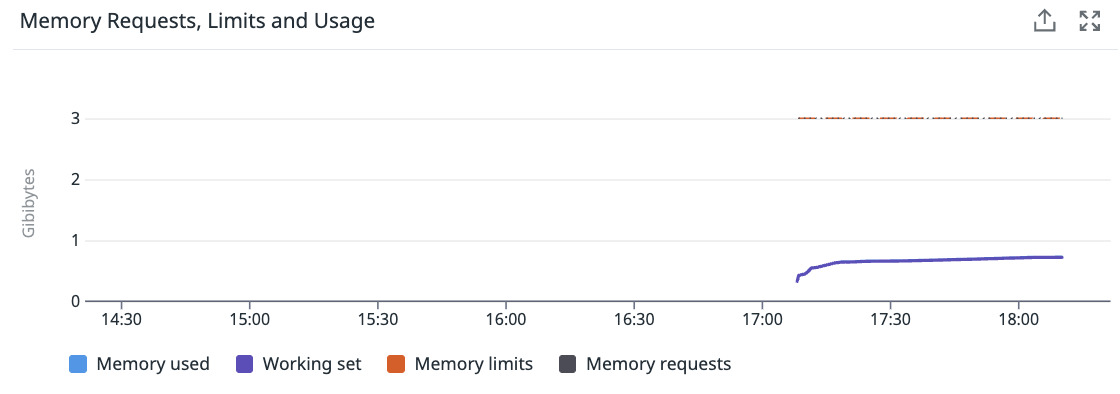
What's very odd though is that the service is actually up! The pod is getting killed constantly, but.. actually 1 pod of the 2 pod deployment is happy. What the heck??
Well, let's see if we're just under-provisioned / give it a bit more room to see what happens. Let's give it 3GB as overkill and see what happens.

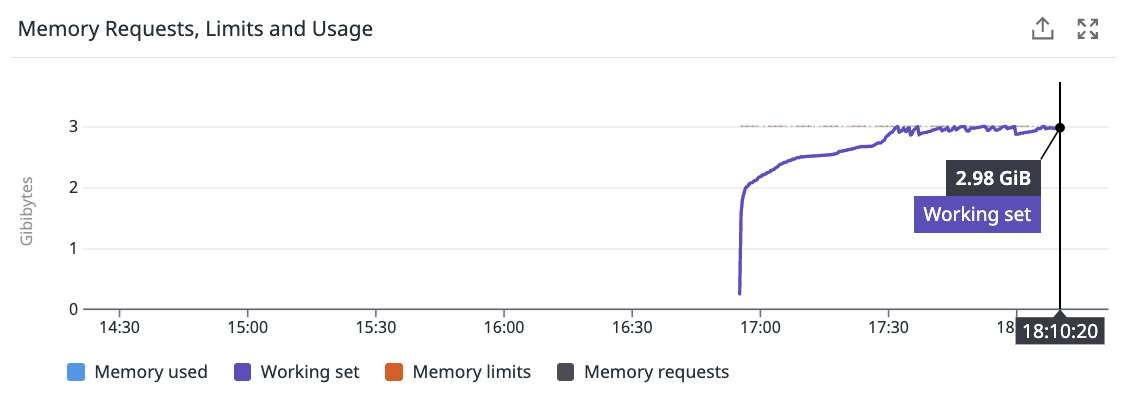
Nope! That's a hungry hungry hippo, easily chewing through 3GB of memory.

Time For More Information
So ok, looks like some kind of looks memory leak, so let's get some more info. First we turned on data dog profiling.
To do that we run app with ddprofrb ie bundle exec ddprofrb exec rails server -p 3000 -b 0.0.0.0 and set the ENV vars:
  DD_PROFILING_ENABLED: "true"
  DD_PROFILING_ALLOCATION_ENABLED: "true"
  DD_PROFILING_EXPERIMENTAL_HEAP_ENABLED: "true"  #alpha!
  DD_PROFILING_EXPERIMENTAL_HEAP_SIZE_ENABLED: "true" #alpha!
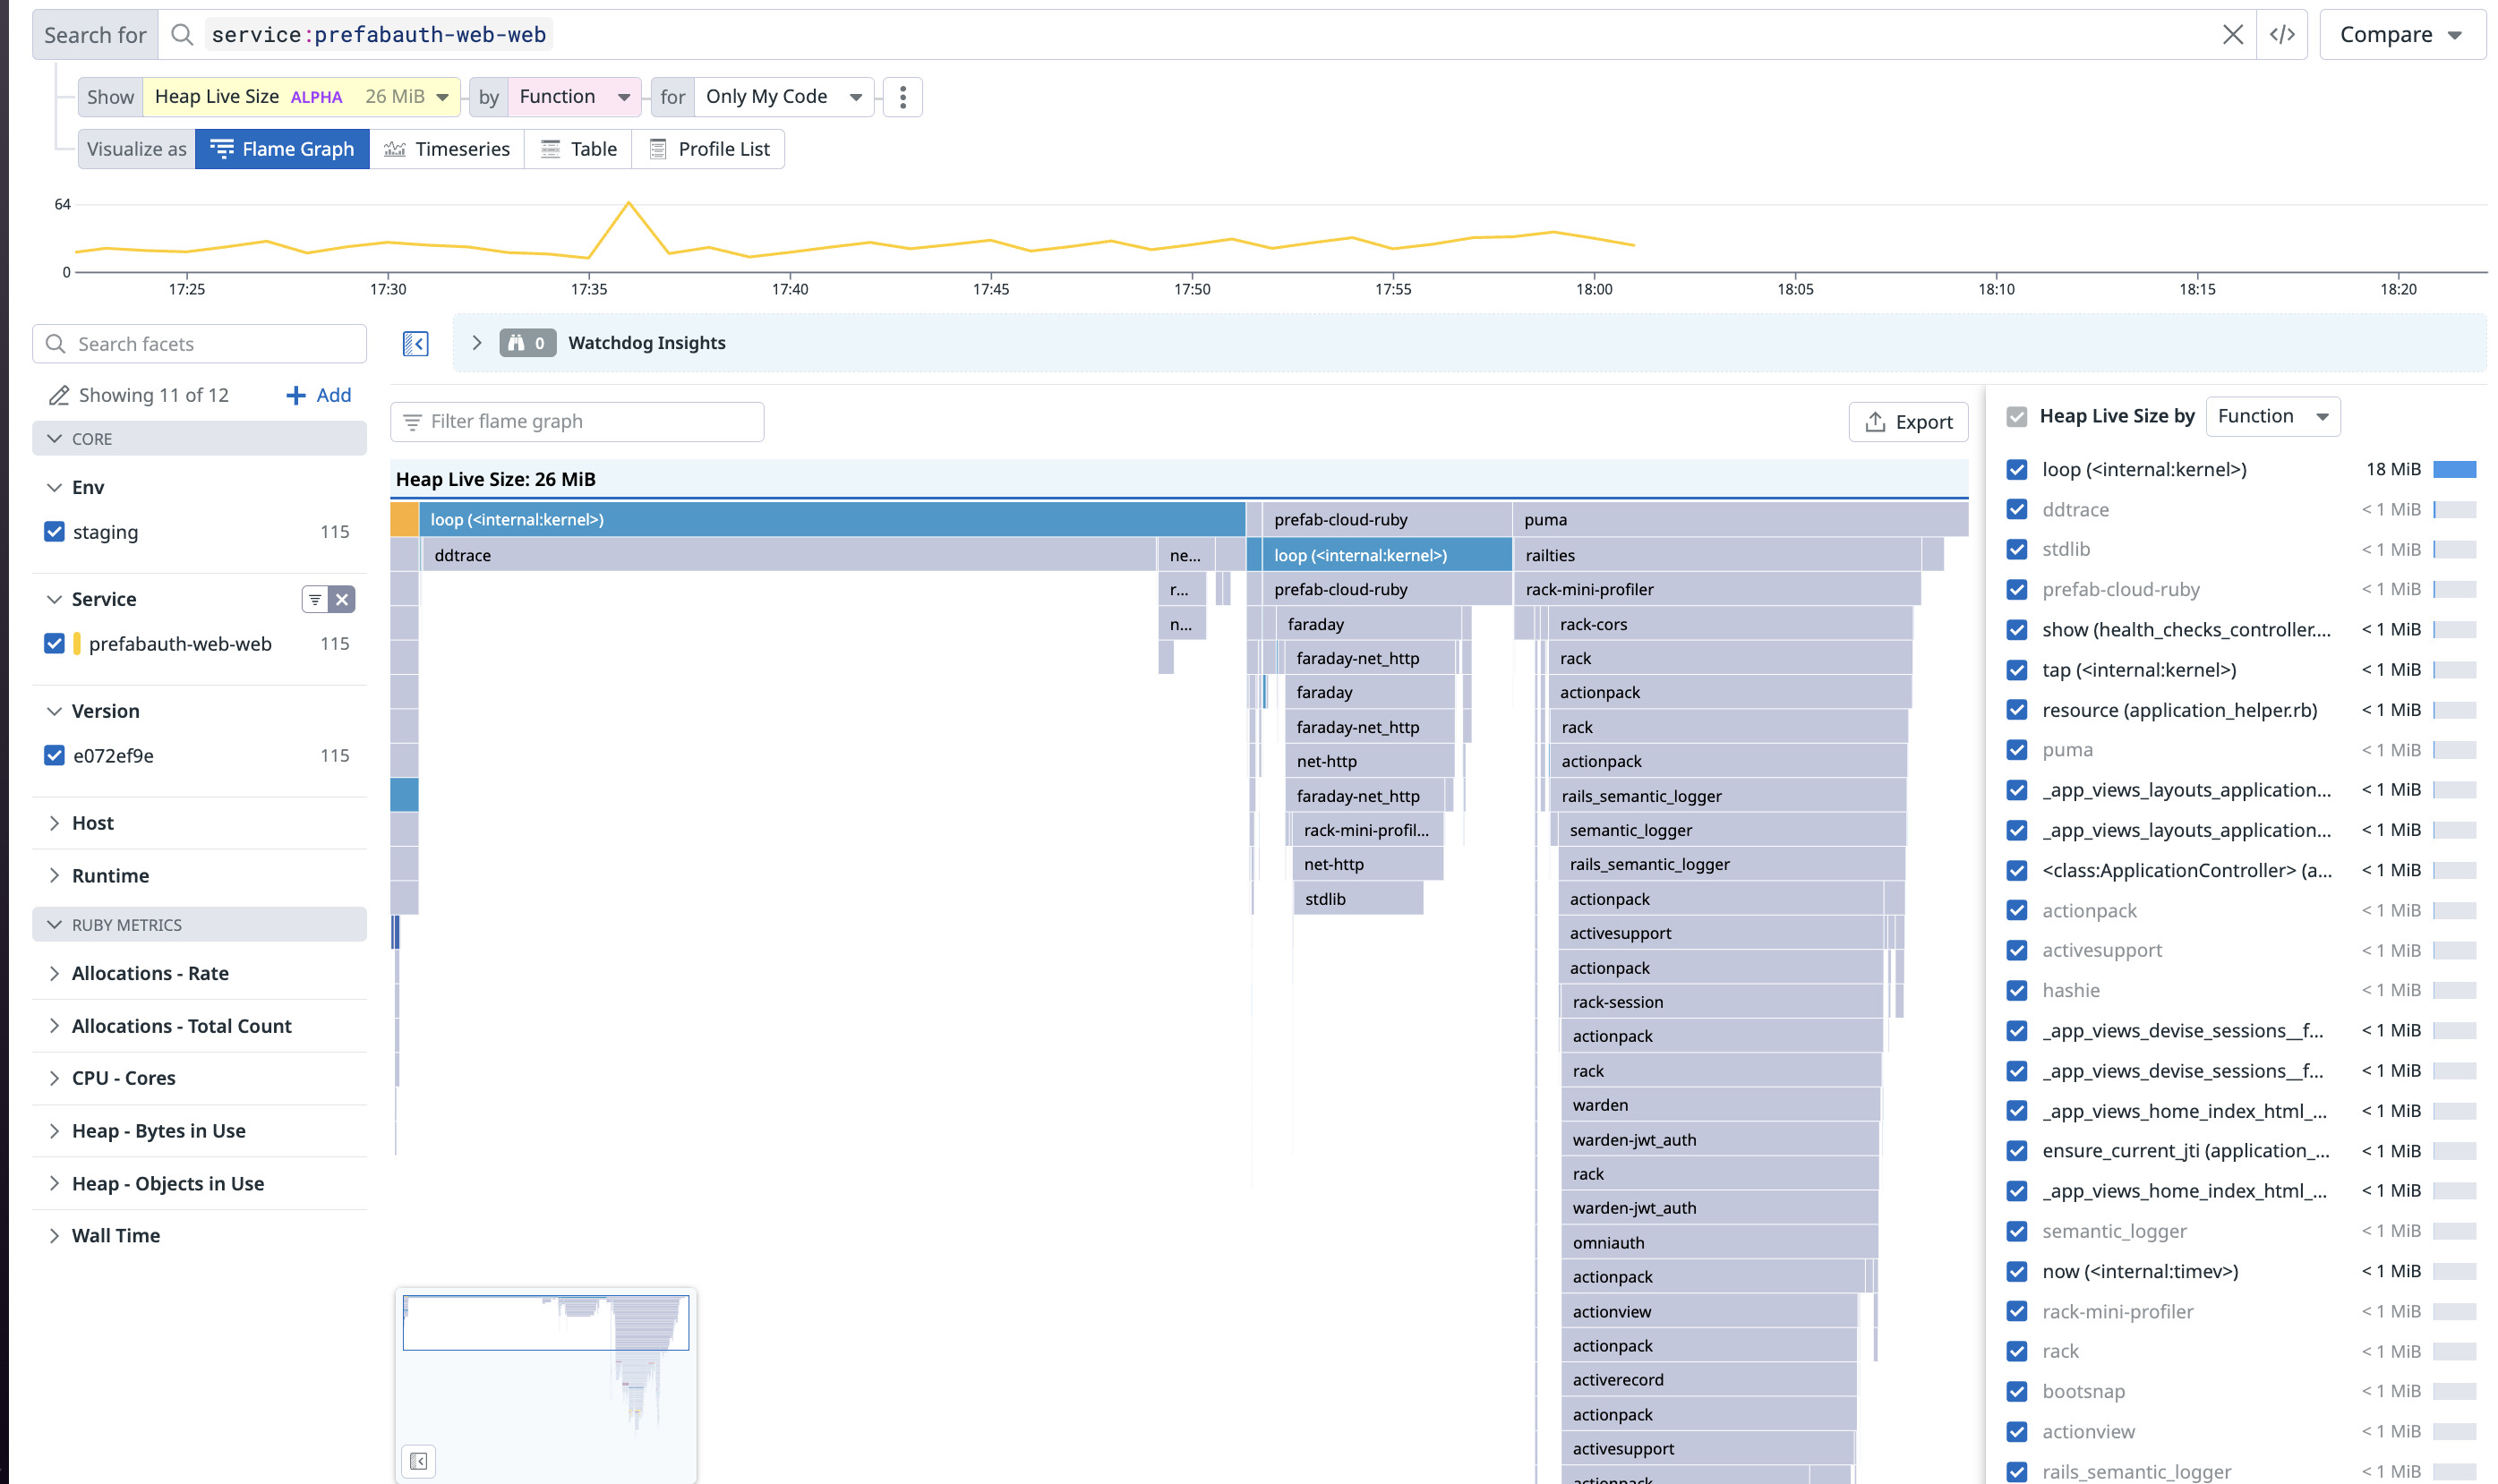
And here's what we get:

Huh.. those are pretty pictures, but... I don't see any sign of a memory leak. Allocations, heap all look fine. If anything it's reporting way too small. It's saying there's only 26mb and it's not growing. huh.
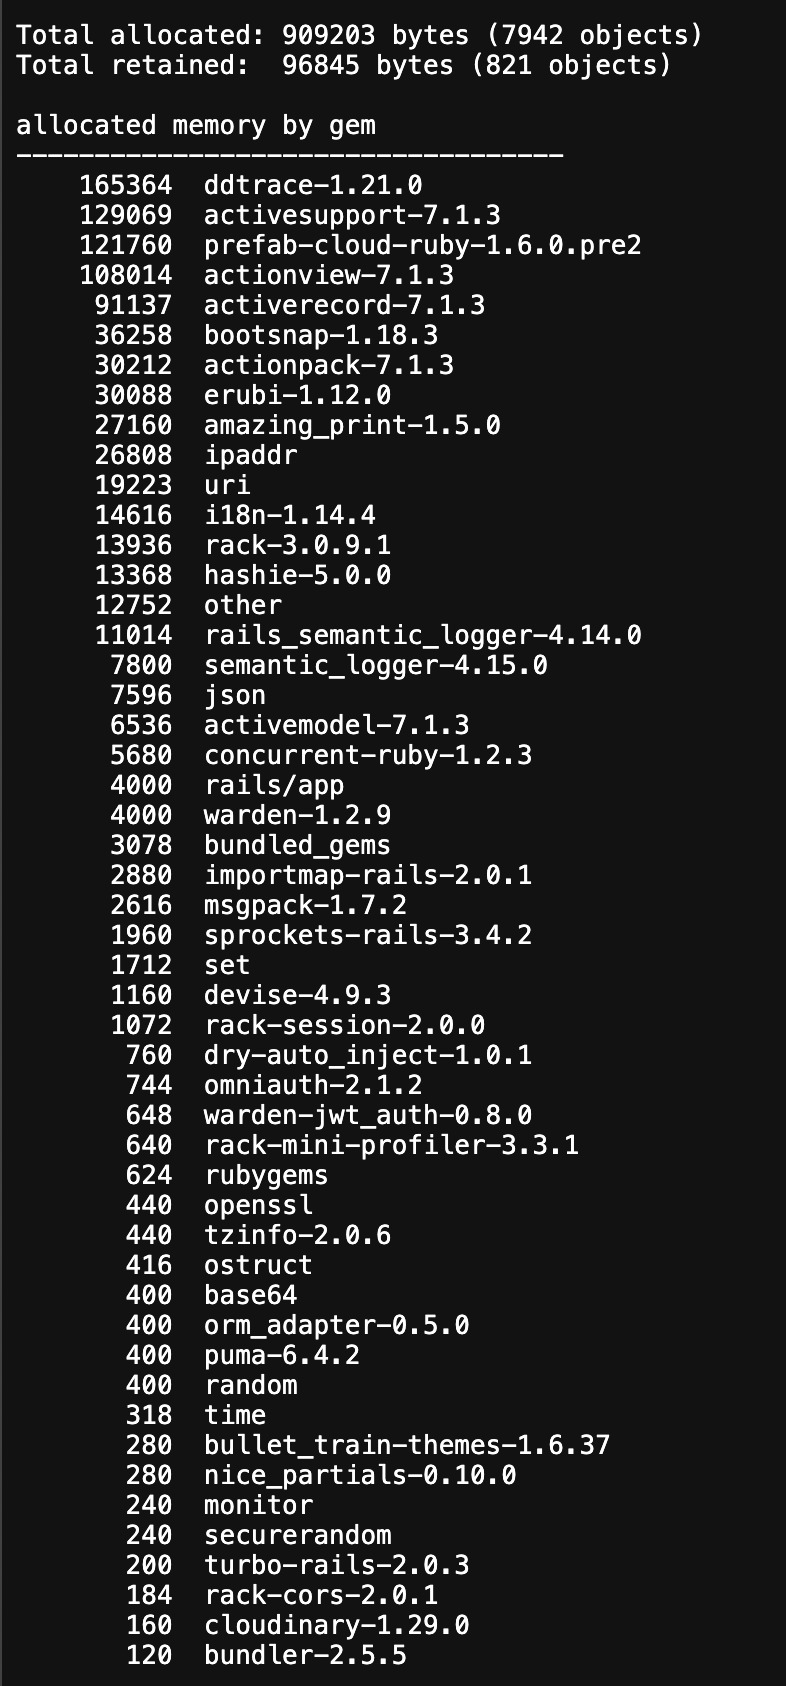
Ok, well let's try some rack-mini-profiler, because I've had luck with that before. This let's us append ?pp=profile-memory to any URL and get output that includes:

and... basically same thing.
Allowing just anyone to ?pp=profile-memory on your production instance is a terrible idea, so this doesn't work out of the box. I enabled it with:
#application_controller.rb
  before_action do
    if Prefab.enabled?("rack.mini-profiler")
      Rack::MiniProfiler.authorize_request
    end
  end
and
#application.rb
config.to_prepare do # https://github.com/MiniProfiler/rack-mini-profiler/issues/515
  Rack::MiniProfiler.config.enable_advanced_debugging_tools = Prefab.get("rack.mini-profiler.enable_advanced_debugging_tools")
end
Which let me turn this on as a targeted feature flag.
Either way, I'm not seeing anything suspicious here. The overall memory allocations are nothing like the 3GB monster that I'm seeing in the Datadog metrics.
At this point I'm pretty confused. Conventional wisdom on the Internet is that jemalloc is better, so I threw that at the wall.
RUN apt-get update && apt-get install -y libjemalloc2
ENV LD_PRELOAD=libjemalloc.so.2
That shouldn't fix a leak, but... maybe magic happens? Nope. No discernible change.
Allright... Time to Think
Let's recap:
- 1 Deployment with 2 pods: one good, one evil.
- Evil pod is a very hungry hippo. Easily gets to 3gb quickly.
- Memory profiling tools don't reflect this usage, more like 90MB.
- Running on a GKE autopilot kubernetes cluster.
- Brand new Rails 7.1.3 application.
- Many other rails apps working fine with the same env vars, application.yaml etc.
So, can you figure it out? Time for some classic choose your own adventure:
- If you think there's a bug in Rails turn to page 33.
- If you think there's a memory leak in our code turn to page 43.
- If you think this is a Kubernetes issue turn to page 56.
- If you think DHH is personally at fault turn to page 88.
And what would you do as next steps?
- Give the pods 34 GB of memory and cross your fingers.
- Get deep in the code trying to print out more ObjectSpace to see where this leak is.
- Go old-school and run
topon the servers. - Investigate Ruby memory management eg
RUBY_GC_MALLOC_LIMIT_MAX&RUBY_GC_HEAP_GROWTH_FACTOR. - Try to reproduce locally under load.
- Other.
While you wait I'll make a brief plug for:
Feature Flags are great and you should use them. This was not a very fun day at the office, but all this sleuthing around would've been soooo much worse if there were any customers using this service. As is this just made a lot of noise and affected internal testing, but we could turn it off at anytime because it was flagged.
So we had a lot of alarms going off because something was unhappy in production, but there was no actual impact on customers. This is living the Feature Flag dream!
So use feature flags everyone. Use your internal tool or some other SaaS or ours, but USE THEM! Yay for feature flags.
And the answer is...
If you guessed it's DHH's fault you win! (Please read this with the loving kindness I intend, I just had a chuckle that it was actually his commit that caused this issue.)
The answer is that a commit in a very recent Rails release triggered our app to behave weirdly when deployed.
So what is the issue?
Rails recently did a bunch of upgrades to the default puma configuration. This issue in particular was actually really interesting and an awesome look at a lot of smart people negotiating in public: https://github.com/rails/rails/issues/50450. The upshot is while Rails did a bunch of work on Puma and while better in most cases, one commit had some pathological behavior on shared hosting.
Rails / Puma is different then many other languages / frameworks in that it typically uses a combination of threads and workers. In other languages like Java you would run a single process and then parallelize with threads. In Ruby it's common to do process fork to gain parallelism with shared memory. Forking is when we get another copy of our process. It shares some memory because of copy on write, but in general it's a whole new process with its own memory overhead.
With that in mind, here's the problematic commit. https://github.com/rails/rails/commit/839ac1e70f7fd340a93348d54cde626fbdbedcb6
worker_count = ENV.fetch("WEB_CONCURRENCY") { Concurrent.physical_processor_count }
Can you see the issue yet?
The key diagnostic step that blew the case wide open was the humble top command. James ran it on the happy pod and saw a handful of ruby processes. Then he tried it on the evil pod and saw... OMG SO MANY RUBY. Yep, 32! ruby processes all chugging away.
What happened? Physical Processors In A Virtual World
We're running GKE autopilot. This is a fully managed kubernetes that is very easy to set up and we quite like. We don't need to worry about anything expect our pods and how much cpu / memory we want them each to have.
This is fine, up until the point that a pods starts asking tough questions about the underlying hardware. Shared hosting means my pod may be on a 4CPU instance or a 64CPU instance. In our case, we have 2 pods guaranteed to run on different instances because of anti-affinity rules. In particular, one of the pods ended up on a e2-standard-4 and one is on a e2-highcpu-32. So one pod was running with 4 workers and one was trying to spawn 32 workers. That explains the 3GB of memory usage!! And this explains why we had one good pod and one evil pod.
I believe it also explains is why the Datadog profiling and ruby memory profiling tools didn't work as expected. Each worker of a ruby process is a FORK. It's a different pid, different process, no communication back to the mothership. So when we're running ObjectSpace and other things, we must just looking at our little slice of the universe, and each slice of the universe was fine. It was just a case of too many slices.
This also explains why this only affected our newest app. This change came into Rails recently in the 7.1.0.beta1 and this was our only app on Rails 7.1.
Good News
The good news is that it's not in rails/main as it was reverted in https://github.com/rails/rails/commit/379d7951f1ea92b925d2fab44b3e7e0245456c74.
Bad news is that it's not in a released version yet (latest is 7.1.3.2). But I'm sure it'll be out soon.
Summary
We did it! We removed Concurrent.physical_processor_count by hand and replaced it with our config system since that's how we roll. For us that looked like the following, but ENV vars or hardcode would fix too.
threads Prefab.get("rails.min.threads"), Prefab.get("rails.max.threads")

if Prefab.get("rails.worker.count") > 1
  require "concurrent-ruby"
  workers Prefab.get("rails.worker.count")
end
And it worked! Our hippos have been satiated.

My particular take-away from this was a reminder to my future self that forking makes diagnostic / observability tools behave quite differently from some of my expectations. That's a tricky one to keep in mind as I bounce between languages.
Hope you enjoyed the ride!
